23 results
High school statistics research $5-10
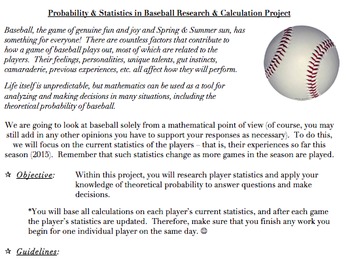
Probability & Statistics in Baseball Project (Common Core Aligned, AND FUN!)
The problems and activities within this document are designed to assist students in achieving the following standards: 6.SP.B.5, 7.SP.C, HSS.CP.A.2, HSS.CP.A.3, HSS.CP.B.7, HSS.CP.B.9, as well as the standards for mathematics practice and the literacy standards. They are also designed to help the teacher assess the students’ abilities when it comes to working with the ideas within the standards.This document contains the following:A project designed to allow students to investigate theoretical
Subjects:
Grades:
5th - 12th, Higher Education, Adult Education, Staff
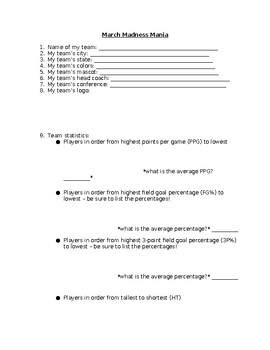
NCAA March Madness Basketball Tournament Team Research Statistics
Do you have students interested in the March Madness basketball tournament? Then this is the activity you need!To begin our March Madness unit, we look at all of the teams participating in the tournament and complete a map together to show where each team is from. We notice that some states have more than others and some states have none, and spend time discussing why that might be. Students will complete their own March Madness bracket.Students will then select a team in the NCAA March Madness
Grades:
4th - 9th
Types:

Scatter Plot and Bivariate Data Research Project
Students will begin a statistics project on one of their favorite restaurants or food chains! They will be researching nutrition facts and surveying others on what types of food they like to eat there. Through this data collection they will work on their skills of creating scatter plot graphs, creating relative frequency tables, and analyzing this data. This can be used either by paper or digitally. I used it the last two years during distance learning. Rubric included.
Subjects:
Grades:
7th - 12th
Types:
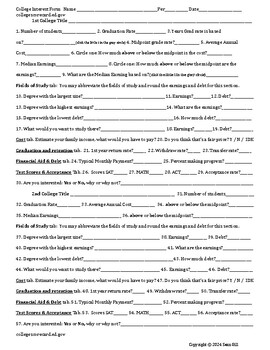
College Research Project Unit
This is an excellent unit on college research. If your school is college focused or you just need a interested based project to get the students engaged, this is a great way to get kids interested in colleges and their stats. Did you know that the federal government compiles all the FAFSA data? It keeps track of how much money each person who filled out a FAFSA makes over the long term (10 years+). There is a wealth of data on every college that has ever accepted federal funding and it is all at
Subjects:
Grades:
6th - 12th
Types:
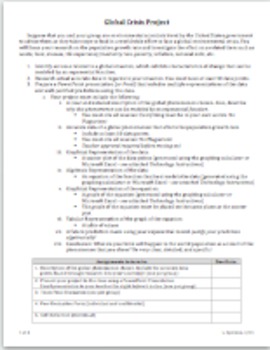
Global Crisis Project (Exponential Functions)
The goal of the Global Crisis Project is to have students see and understand real applications for exponential functions. Students will do research on the population growth rate (globally or they may choose a specific location) and investigate the effect that a related global issue such as waste, food, disease, life"expectancy/mortality rate, poverty, inflation, national debt, etc. has on population. Students find accurate data points from reliable internet sources, and will use exponential reg
Subjects:
Grades:
9th - 12th
Also included in: Math in the Real World Projects Bundle
Statistics Research Project
This project can be done in an Algebra 1 class or in a beginning Statistics class.Through this project students will...- Create a two-question survey questionnaire (using Google Forms).- Conduct a survey that will produce quantitative data.- Interpret survey data, and use Desmos to generate the line of best fit.- Find the correlation coefficient and use these values determine how well the line of best fit models the data.- Generate a residual plot and use it to interpret data.- Find the sum of t
Subjects:
Grades:
8th - 12th
Also included in: Math in the Real World Projects Bundle
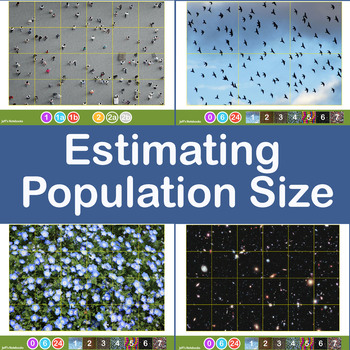
Estimating Crowd and Population Size using Jacob's Method
This investigation delves into estimating the size of a large population of objects by taking a sample and applying some basic mathematics. It encourages sharing of data, refining methods of collection of the data and discussion about the accuracy and limitations of the method used.Jacob's Method of counting large numbers of objects is simple. Draw a grid dividing the area covered into equal size squares. Estimate (by counting) the population of one grid then multiply this by the number of squar
Subjects:
Grades:
6th - 11th, Higher Education, Adult Education
Psychology Dream Analysis Characters and Emotions in Dreams Freud
In these two labs the students analyze a dream set for characters, emotions and animals in dreams respectively. Research says that the characters in women’s dreams are about 50/50, men and women, but in men’s dreams there are more male characters than female characters. One of the labs focuses on this phenomenon. We endeavor to see if this is true in our dream set. The second lab focuses on whether whether or not men or women have more negative or positive dreams. 11/8/22 Animals in dreams is no
Subjects:
Grades:
10th - 12th, Higher Education
Types:
PBL - Advanced (or AP) Statistics - The Changing Face of America
This trimester-long PBL Statistics project aligns with the AP Statistics first trimester curriculum and incorporates the necessary skills ofDisplaying and Describing Categorical DataDisplaying and Summarizing Quantitative DataUnderstanding and Comparing DistributionsUsing the Standard Deviation as a Ruler and the Normal ModelDrawing Scatter-plots and describing Association, and CorrelationThe project’s driving question, which focuses the work, is “Based upon your OWN research, is the US Census
Grades:
10th - 12th
Types:
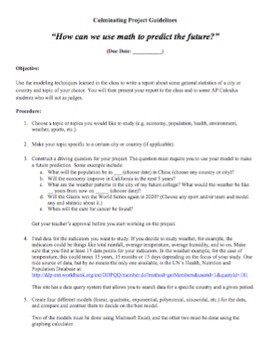
Functions Regressions Project: Using Math to Predict the Future
This project focuses on different kinds of functions and their applications in the real world. Students will “model with mathematics” using different approaches. In this project students will use modeling techniques to make future predictions using general statistics of a city or country and topic of their choice. Students look at different types of data; they analyze and interpret the data to decide which function best models the data. Students generate regressions of different types of functio
Subjects:
Grades:
9th - 12th
Also included in: Math in the Real World Projects Bundle
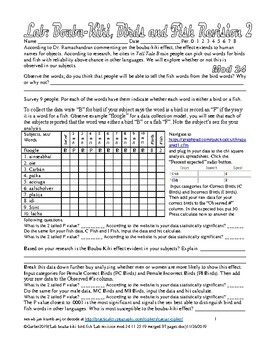
Psychology Lab Bouba Kiki Bird Fish lab Cognition Language
According to Dr. Ramachandran, commenting on synesthesia and the bouba-kiki effect, the effect extends to human names for objects. According to research he cites in Tell Tale Brain, people can pick out words for birds and fish with reliability above chance in other languages. We will explore whether or not this is observed in our population.Survey 24 non-psych friends. For each of the words have them indicate whether each word is either a bird or a fish.This is cool because my students almost al
Subjects:
Grades:
9th - 12th, Higher Education, Adult Education
Types:
Analyzing and Interpreting Quantitative Data Assessment
This product contains a set of 26 multiple-choice questions focused on quantitative data analysis. It is designed for educators, researchers, and students who want to test their knowledge or prepare for exams in this field.Each question is structured to test the reader's understanding of a specific aspect of quantitative data analysis. The questions cover a range of topics, including statistical software selection, data cleaning, missing data, hypothesis testing, and effect size.The questions ar
Subjects:
Grades:
11th - 12th, Higher Education, Adult Education
Types:
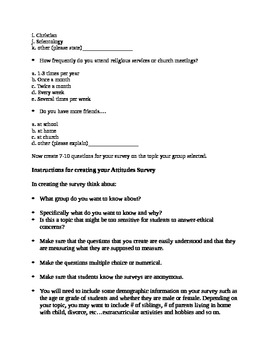
Research Paper-integrating Math and Science
This is a research paper that breaks down the topic and methodology into sections. The project is student driven. Student groups decide on a reseach topic that they can actually research but also create a survey to administer to students in the school so that they are collecting their own data.
The booklet begins with students creating survey questions, but you may want to first have them do the intro to the paper and their hypotheses before creating the survey questions.
Science is integrate
Subjects:
Grades:
7th - 12th, Adult Education
Types:
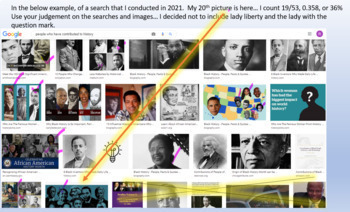
Women's History Month Probability Project
Students learn about suffrage and representatio of women. Students conduct Google searches on favorite subject, sport/hobby, future career and find the probability of a woman appearing in the first 20 images. Students make conjectures about representation of women in those areas. Students identify women they admire and create a video summarizing their findings.Can be adapted to images for African Americans for Black History Month, Hispanic Americans for Hispanic Heritage Month, etc.
Subjects:
Grades:
6th - 12th, Adult Education, Staff
Data & Statistics Scavenger Hunt
This scavenger hunt requires students to locate 16 different types of graphs. Vocabulary terms are also included, such as "Measures of Central Tendency", "extrapolation," etc. Optional, supplemental, as well as evaluation tools are included. This scavenger hunt could be used a mini-course about basic statistic concepts.
By Math Fan
Subjects:
Grades:
8th - 10th
Types:
TEST: Quantitative Data Collection - Sampling, Instruments, and Analysis
This test is designed to evaluate your understanding of key concepts related to quantitative data collection. It consists of 17 multiple-choice questions that cover a range of topics, including sampling procedures, instrument selection, and data analysis.The test begins by assessing your knowledge of unit of analysis, permissions required before beginning a study, and different types of populations and sampling procedures. It then moves on to explore the best sampling procedures to use in differ
Subjects:
Grades:
11th - 12th, Higher Education
Types:

End of Year Project
There are 3 projects in this bundle. I let students choose which option they wanted to do for their end of the year project.
The 1st project is creating a zoo with given parameters.
The 2nd project is determining who the best major league baseball player currently in the major leagues is based on research students conduct.
The 3rd project is creating a board game based on different parameters which must include a math concept from the school year.
These are great as end of unit projects or
Subjects:
Grades:
5th - 9th
Easy Statistics Activity - Distance Learning
As the Internet strives for the greatest level of user-friendliness, skillful research is fast becoming the realm of higher education scholars; middle and high school students type a word or phrase into a search engine and believe that the first hit must be the most valid. This product, an Easy Statistics Activity, is a fun, painless start at showing students how the "truths" they encounter via a search engine may or may not be corroborated. In this activity, students do their own field work by
Grades:
8th - 11th
Types:

Statistics 1st Quarter Research Project
In this document, you'll find detailed instructions and grading rubrics for a data collection, organization, and presentation report based project. This is a google doc that will be added to your google drive when you purchase and will be fully editable to customize to your classroom needs. Students will: 1. learn to write an abstract, 2. describe the nature of their data, 3. choose, implement, and describe a sampling method, 4. discuss possible errors, 5. calculate mean, median, mode, midrange,
Subjects:
Grades:
11th - 12th, Higher Education
Types:
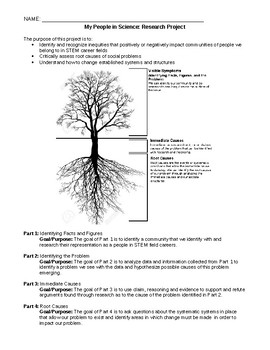
My People in Science Project
The purpose of this project is to:
• Identify and recognize inequities that positively or negatively impact communities of people we belong to in STEM career fields
• Critically assess root causes of social problems
• Understand how to change established systems and structures
Students will choose a community they identify with and will be conducting a thorough research project to find out this community's role in STEM subjects.
Grades:
6th - 12th
Types:

Statistics Probability Report Project
In this document, you'll find detailed instructions and grading rubrics for a probability based project which includes the design and creation of a unique game, the testing of that game, and the calculation of various probabilities resulting from the game. This is a google doc that will be added to your google drive when you purchase and will be fully editable to customize to your classroom needs. Students will: 1. learn to write an abstract, 2. create and write instructions for a unique game, 3
Subjects:
Grades:
11th - 12th, Higher Education
Statistics newswriting group project
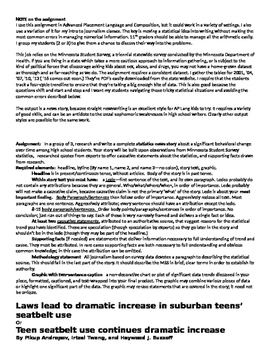
A multiday project for advanced writers. Students use high-school health survey data (the Minnesota Student Survey or similar) to identify a trend over time in student behavior, then write about it in news style. Packet includes assignment parameters, explanations and demonstrations of the principles of newswriting, examples of newswriting with a statistical finding, step-by-step instructions for finding and documenting a trend, a glossary of relevant statistics terms, an explanation of various
Subjects:
Grades:
10th - 12th, Higher Education

Statistics Hypothesis Testing Research Project
In this document, you'll find detailed instructions and grading rubrics for a hypothesis testing research project and report. This is a google doc that will be added to your google drive when you purchase and will be fully editable to customize to your classroom needs. Students will: 1. learn to write an abstract, 2. determine null and alternative hypotheses, 3. choose, implement, and describe a sampling method and experimental design, 4. discuss possible errors, 5. calculate a confidence interv
Subjects:
Grades:
11th - 12th, Higher Education
Types:
Showing 1-23 of 23 results


