35 results
High school statistics internet activities $5-10
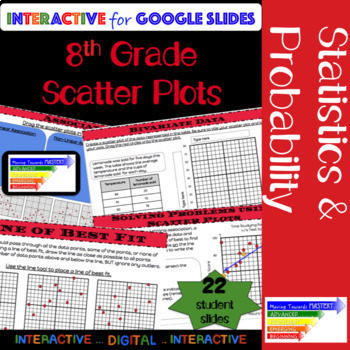
8th Grade Math Scatter Plot: Guided Interactive Lesson
Extensive ALL digital guided lesson for constructing and interpreting scatter plots.The slides are scaffolded to build understanding. Students will progress from identification of terms to making predictions involving bivariate data. The guided slides will begin with identification, move towards assisted analysis, and conclude with independent practice.Slides include...♦ Definitions and Visual Representations♦ Identification and Use of Terms→ Bivariate Data→ Scatter Plot→ Linear, Nonlinear, &
Subjects:
Grades:
8th - 10th
Types:
CCSS:
Also included in: 8th Grade Math Common Core Growing Bundle
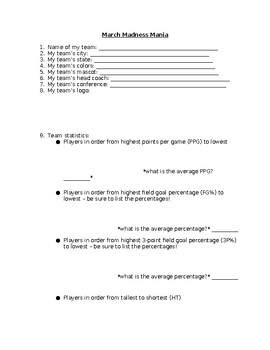
NCAA March Madness Basketball Tournament Team Research Statistics
Do you have students interested in the March Madness basketball tournament? Then this is the activity you need!To begin our March Madness unit, we look at all of the teams participating in the tournament and complete a map together to show where each team is from. We notice that some states have more than others and some states have none, and spend time discussing why that might be. Students will complete their own March Madness bracket.Students will then select a team in the NCAA March Madness
Grades:
4th - 9th
Types:
Interpreting Visual Displays of Data Bundle *Google Classroom* Distance Learning
This bundle will provide your students with practice interpreting data and finding central tendency. Includes activity for:Central TendencyInterpreting Dot PlotsInterpreting HistogramsInterpreting Frequency TablesInterpreting Box and Whisker Plots2 Ways to Assign Each Activity - I've included these resources as both a google form and google slides. When using the google form, students will type the answers into a google form quiz and it will grade it for you! When using the google slides, studen
Subjects:
Grades:
5th - 9th
Types:
Statistics & Data ★ Math TEK 8.11A 8.11B 8.11C ★ Digital 8th Grade Math Review
Are you looking for a unit's worth of engaging printable & digital activities that cover the whole 8.11 TEKS Math Domain (Statistics and Data) while being immediately implementable in printable and digital formats? If that sounds like something you might be interested in, I'm confident this product is going to meet and exceed your expectations!If accessed digitally, these task card sets can be pre-loaded as no-prep assessments/assignments through Google Forms™, Google Slides™, or as a Boom
Subjects:
Grades:
8th - 9th
Types:
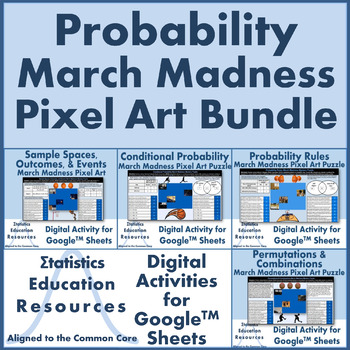
Bundle: Probability March Madness Pixel Art Puzzles (Common Core Aligned)
This bundle includes 4 self-checking March Madness pixel art probability puzzles created in Google™ Sheets. Students practice solving problems on sample spaces, conditional probability, probability rules, permutations, and combinations while solving March Madness puzzles. Students use both computation and contextual interpretation to solve problems. This fun twist on worksheets engages students by allowing them to independently solve March Madness pixel art puzzles as they reinforce probability
Subjects:
Grades:
9th - 12th
Types:
CCSS:
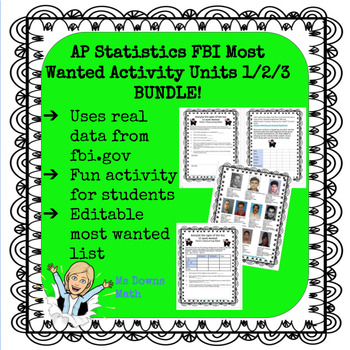
FBI Most Wanted AP Stat - Analyze Data, Normal Distributions, Linear Regression
I have created a series of activities for several units in the AP Statistics curriculum. The students love using data from fbi.gov to review concepts. This activity involves analyzing data related to the top 10 most wanted fugitives. I created this activity in May of 2020 and used the top 10 at that time. In the folder, you will find an editable slide of the top 10 if you want to change it.The answer key for the unit is based on the original top 10 that I used. Teachers have the option of having
Subjects:
Grades:
10th - 12th
Types:
CCSS:
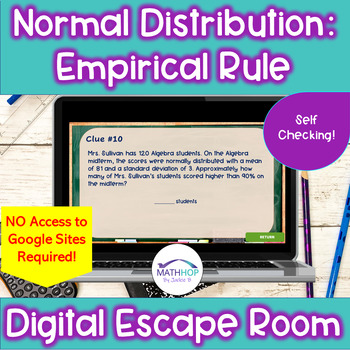
Normal Distribution: Applying the Empirical Rule: Digital Escape Room
Do you need an ENGAGING, & Self Checking activity on solving word problems using the Empirical Rule? All clues contain a word problem that asks the students to interpret a normal distribution and use the empirical rule to solve investigative questions. This is an essential skill for Statistics that students struggle with. 100% Digital & Self Checking – this escape room is ready to go and is NOT housed on a Google Site. Just share the Genially link with students you can also share the lin
Subjects:
Grades:
10th - 12th
Types:
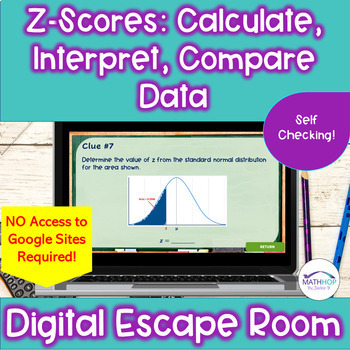
Z-Scores: Calculate, Interpret & Compare Data: Digital Escape Room
Do you need an ENGAGING, & Self Checking activity on: solving word problems involving determining, interpreting, and using z-scores to solve problems and compare data? All clues contain a word problem that asks the students to solve a problem involving data and z-scores. A z-scores table is included to give to students. Using z-scores is an essential skill for Statistics that students struggle with. 100% Digital & Self Checking – this escape room is ready to go and is NOT housed on a Goo
Subjects:
Grades:
10th - 12th
Types:
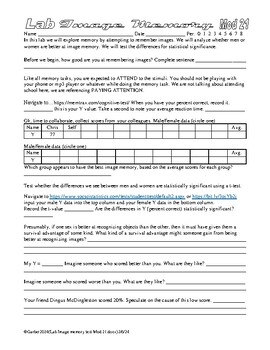
Psychology Lab Image Memory and Sex Differences AP Psychology Statistics
In this set of 13 labs the students do a variety of image memory tasks. They then collaborate and share data, then perform a T test on the data to find out if the differences between the scores of men and women are statistically significant. The students also test for correlations between a variety of scores. I suppose it is a sort of an expansion on my face memory lab. Links sometimes die, so try before you buy… https://www.psychologytoday.com/us/tests/iq/memory-test https://memtrax.com/cogniti
Subjects:
Grades:
9th - 12th, Higher Education, Adult Education
Types:
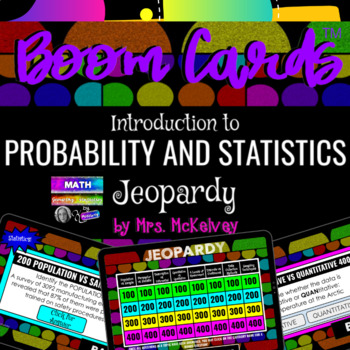
Intro to Statistics Jeopardy Review Game using DIGITAL SELF CHECKING BOOM CARDS™
Probability and Statistics students will enjoy reviewing population vs. sample, parameter vs. statistic, descriptive vs. inferential, quantitative vs. qualitative, the four levels of measurement, discrete vs. continuous, data collection methods, and sampling techniques with these fun and interactive digital Boom task cards! This deck is in the form of a Jeopardy style game, using Flow Magic to help students navigate from the game board, to feedback, and back to the game board for the next round!
Subjects:
Grades:
11th - 12th, Higher Education
Types:
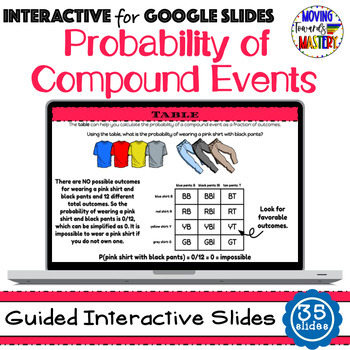
Probability of Compound Events Guided Interactive Digital Lesson & Practice
Extensive digital guided lesson and practice activity for probability of compound events using organized lists, tree diagrams, & tables. This interactive lesson provides slides for teaching and practice.The slides are scaffolded to build understanding & provide differentiation. Students will progress from introduction of compound events to solving real world probability problems using various strategies. The guided slides will begin with information, move towards assisted practice, and c
Subjects:
Grades:
7th - 9th
Types:
CCSS:
Also included in: Middle School Math Digital Guided Interactive Lessons
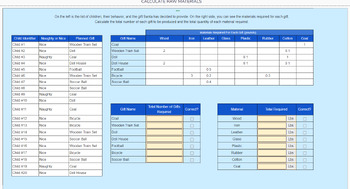
Santa's Workshop : Interactive Lab
Students will calculate the material required for providing gifts for 25 children, and then learn and use spreadsheet functions to calculate for 1000 children.Preview Link: Lab previewAssign this interactive and digital lab to your classroom now.Detailed Description:Santa uses a Naughty and Nice list to choose the gift for each child. For nice children, they get the gift they most desire. For naughty children, they get a lump of coal.Students are provided with a small list of Naughty and Nice ch
Grades:
10th - 12th
Types:
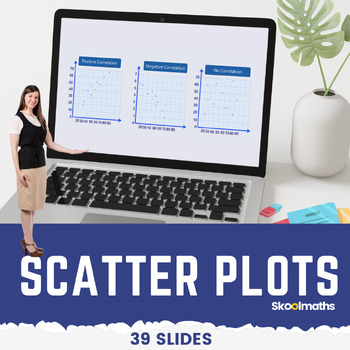
Eight Grade Scatter Plots Digital Math Lesson and Activities CCSS 8.SP.A.1
Eight Grade Scatter Plots Digital Math Lesson and ActivitiesTeach your high school grade how to use and interpret scatter graphs; recognize correlation; draw and use lines of best fit to make predictions?In this lesson, learners will be able to:use and interpret scatter graphs of bivariate data;recognize different types of correlation;draw estimated lines of best fit; anduse lines of best fit to make predictions.
Subjects:
Grades:
8th - 10th, Staff
Types:
CCSS:
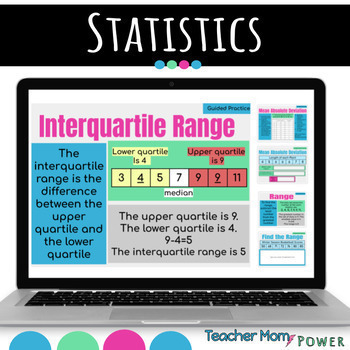
Statistics Digital Unit: Math Stats Lesson & Activities {Google Slides}
Digital Statistics UnitThis Digital Resource can be used as-Google SlidesGoogle Classroom AssignmentAdd to Google DriveUse a PowerPointAssign via other digital meansUsage Suggestions and IdeasThis resource can be utilized in numerous ways, here are some ideas:use for guided practiceassign as partner workassign as independent practicecan be used for morning workuse for reteaching in small group settinguse as review prior to assessmentuse as review in continuing to strengthen skillassign for homew
Subjects:
Grades:
4th - 9th
Types:
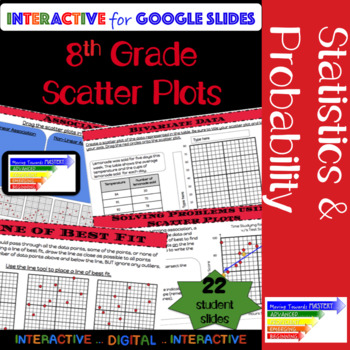
Scatter Plot Interactive for Google Classroom
Extensive ALL digital guided lesson for constructing and interpreting scatter plots.The slides are scaffolded to build understanding. Students will progress from identification of terms to making predictions involving bivariate data. The guided slides will begin with identification, move towards assisted analysis, and conclude with independent practice.Slides include...♦ Definitions and Visual Representations♦ Identification and Use of Terms→ Bivariate Data→ Scatter Plot→ Linear, Nonlinear, &
Subjects:
Grades:
8th - 10th
Types:
CCSS:
Also included in: Middle School Math Digital Guided Interactive Lessons
Bundle: Probability Thanksgiving Pixel Art Puzzles (Common Core Aligned)
This bundle includes 4 self-checking Thanksgiving pixel art probability puzzles created in Google™ Sheets. Students practice solving problems on sample spaces, conditional probability, probability rules, permutations, and combinations while solving festive Thanksgiving puzzles. Students use both computation and contextual interpretation to solve problems. This fun twist on worksheets engages students by allowing them to independently solve Thanksgiving pixel art puzzles as they reinforce probabi
Subjects:
Grades:
9th - 12th
Types:
CCSS:
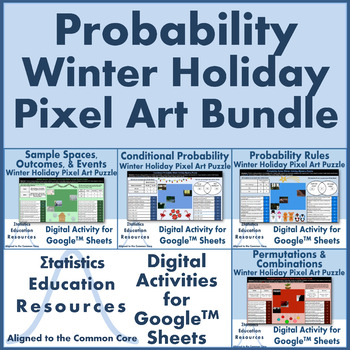
Bundle: Probability Winter Holiday Pixel Art Puzzles (Common Core Aligned)
This bundle includes 4 self-checking Winter Holiday pixel art probability puzzles created in Google™ Sheets. Students practice solving problems on sample spaces, conditional probability, probability rules, permutations, and combinations while solving festive and snowy Winter Holiday puzzles. Students use both computation and contextual interpretation to solve problems. This fun twist on worksheets engages students by allowing them to independently solve Winter Holiday pixel art puzzles as they r
Subjects:
Grades:
9th - 12th
Types:
CCSS:
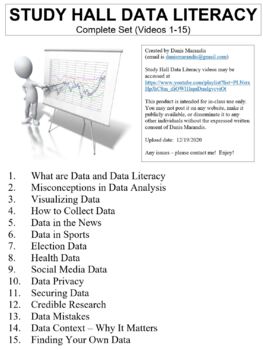
Study Hall Data Literacy Worksheets Complete Series Set Full Bundle Collection
This ZIP file contains Microsoft Word document worksheets (along with PDF versions) for each of the fifteen episodes of Study Hall Data Literacy hosted by Jessica Pucci.Worksheets contain a combination of fill-in-the-blank and short answer questions. Each worksheet is accompanied with an answer key and relevant images.By purchasing this file, you agree not to make it publicly available (on external websites, etc.) or to share with any other teachers. It is intended for classroom use only. You *
Subjects:
Grades:
9th - 12th, Higher Education
Types:
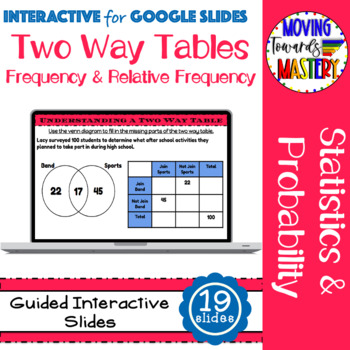
Two Way Frequency Tables Guided Interactive Digital Lesson & Practice Activity
Extensive ALL digital guided lesson for constructing and interpreting two way frequency tables. This interactive lesson provides slides for teaching and practice.The slides are scaffolded to build understanding. Students will progress from identification of terms to analyzing data involving bivariate data. The guided slides will begin with identification, move towards assisted analysis, and conclude with independent practice.Slides include...♦ Definitions♦ How to Construct a Two Way Table♦ How t
Subjects:
Grades:
8th - 10th
Types:
CCSS:
Also included in: Middle School Math Digital Guided Interactive Lessons
Correlation Connection: State Population vs. COVID-19 Cases
In this activity, students will compare the number of active COVID-19 cases in each state to the state's population. They will use the data values to create a scatterplot, find the linear regression and correlation coefficient, and then answer questions about the data set.An extension activity is included, and it details how to create a scatterplot on Google Sheets, and then analyze data from it.
Subjects:
Grades:
8th - 12th
Types:
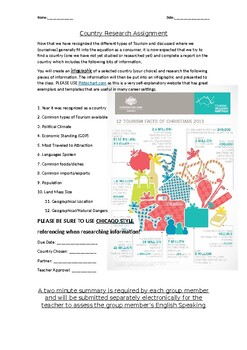
TJF3C (Tourism and Hospitality) ON Curr. Infographic Assignment (.DOC/.PPT/PDF)
Infographic Assignment, rubric (improved from the last), lesson plan, PPT and needed resources are all available here in customizable/editable files for a ridiculously low price of 10$.Feedback, ratings welcomed, and much appreciated. Many people loved the infographic rubrics-especially because of how cheap they are. for just a little bit of a cheaper price, you can walk away with a VERY successful assessment piece for your classroom.Thinking of cross-curricular activities, this might be the ans
Subjects:
Grades:
10th - 12th
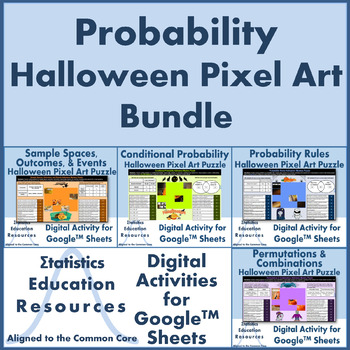
Bundle: Probability Halloween Pixel Art Puzzles (Common Core Aligned)
This bundle includes 4 self-checking Halloween pixel art probability puzzles created in Google™ Sheets. Students practice solving problems on sample spaces, conditional probability, probability rules, permutations, and combinations while solving scary and tasty Halloween puzzles. Students use both computation and contextual interpretation to solve problems. This fun twist on worksheets engages students by allowing them to independently solve Halloween pixel art puzzles as they reinforce probabil
Subjects:
Grades:
9th - 12th
Types:
CCSS:
Pearon's Product - Line of Best Fit, Stats - Interactive Lesson, Notes, HW
If you’re having trouble getting students to stay engaged, take quality notes, try practice problems in class, participate and ask questions in math class, this might be your solution! This lesson balances the use of technology and paper-and-pencil mathematics in a way that students find engaging, and fun, and also provides you with data on student and class performance. In this lesson students will have the hands on learning experience of learning about scatter plots, lines of best fit, linear
Subjects:
Grades:
10th - 12th
CCSS:
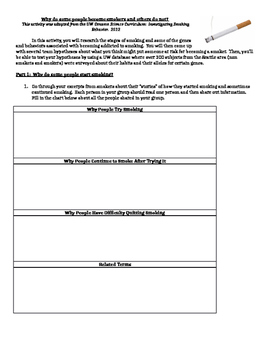
Using Big Data in Biology: Genetics, Smoking, and Statistics
This is a great multi-day lesson for higher level biology classes. The activity focuses around a large research project from the University of Washington which studied multiple factors that play into why some people start and keep smoking (addiction). It ties in genes, inheritance, then environment and statistics. Students are able to come up with their own research projects and use the online database to test their hypotheses. At the end, I have students present their results to the class a
Subjects:
Grades:
11th - 12th, Higher Education, Adult Education
Types:
Showing 1-24 of 35 results


