32 results
High school statistics independent work packets $5-10
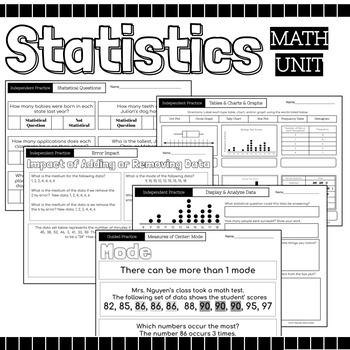
Statistics Math Packet {Data, Charts, Graphs, Mean, Median, Mode, Range, Spread}
52 Page Statics Unit Includes: Guided Instruction & Independent Practice Pages Usage Suggestions and IdeasThis resource can be utilized in numerous ways, here are some ideas:use for guided practiceassign as partner workassign as independent practicecan be used for morning workuse for reteaching in small group settinguse as review prior to assessmentuse as review in continuing to strengthen skillassign for homeworkuse as independent work during math centersTopicsRecognize Statistical Question
Subjects:
Grades:
4th - 12th
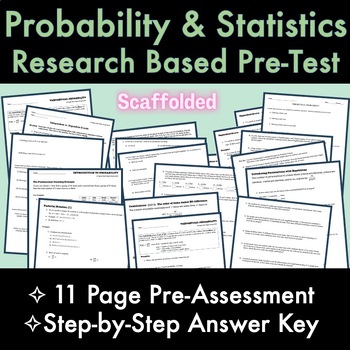
Statistics & Probability RESEARCH BASED 11-Page PreTest/PreAssessment with Key
87 qualified high school math teachers have been surveyed POST-COVID across the 6 subjects (algebra 1, algebra 2, geometry, precalculus, calculus, and statistics & probability). This 11-page research-based scaffolded statistics & probability pretest/ pre-assessment/ common assessment is a compilation of their answers to the question: what do you WISH students knew BEFORE taking the course? The assessment is scaffolded for students as well!---------------------------Check out my other res
Subjects:
Grades:
11th - 12th, Higher Education
CCSS:
Also included in: ALL HIGH SCHOOL MATH SUBJECTS Full PreTests with Keys - RESEARCH BASED
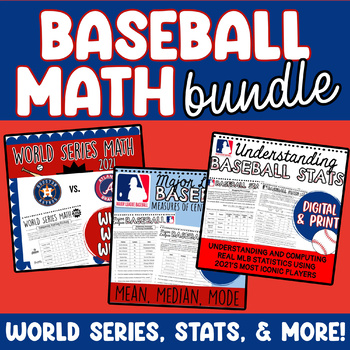
Baseball Math Activities Bundle for Real-World Statistics and World Series
This baseball math bundle includes three real world baseball stats products that are perfect for engaging your sports lovers! Students compute baseball stats, compare world series teams, and explore measures of central tendency using real-world stats!In World Series Math, students must determine which team is more likely to win comparing their players and statistics from the past season. Understanding Baseball Stats explains to students the meaning of common baseball statistics and how to comp
Subjects:
Grades:
6th - 9th
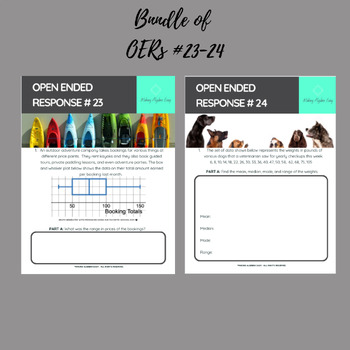
Algebra 1 Keystone Prep: OERs 23-24 Bundle on Data Analysis
This includes OERs #23 & 24. Each include open-ended questions that require students to show and explain their reasoning and to apply the concepts of data analysis involving a box and whisker plot and mean, median, mode, and range. These are appropriate for an Algebra 1 unit on Data Analysis. They are aligned the the Pennsylvania Keystone Exam but are also appropriate for other states for teachers who would like students to apply and explain.
Subjects:
Grades:
8th - 9th
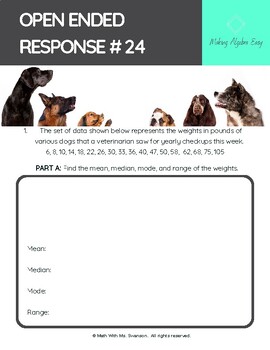
Algebra 1 Keystone Prep - OER 24 on Mean, Median, Mode, and Range
This is an open-ended response style question with multiple parts. This is appropriate for Algebra 1. Students need to first find the mean, median, mode, and range of a data set. They they need to interpret what will happen with the addition of a new data point.Pages 1 & 2 are the student version of the question with a pretty layout.Pages 3 & 4 are the teacher version / detailed annotated answer key.I used the open-ended questions in my Pennsylvania Algebra 1 classroom weekly in order t
Subjects:
Grades:
8th - 9th
Also included in: Algebra 1 Keystone Prep: OERs 23-24 Bundle on Data Analysis

Statistics & Probability
Two documents include questions and related vocabulary terms. The other two documents are the related answer keys.
Subjects:
Grades:
10th - 12th, Higher Education
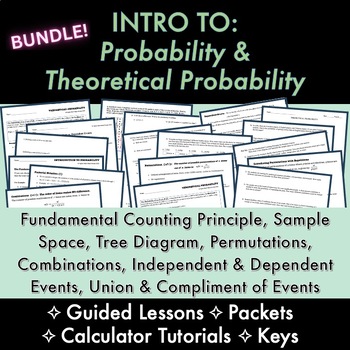
BUNDLE: Intro to Probability & Theoretical Probability LESSONS, PACKETS, KEYS
➤ LESSON 1: Intro to probability full 2 to 3-day GUIDED-NOTES lesson packet, 40 total exercises (can be used as classwork and/or homework), notes and step-by-step answer keys. What is the Fundamental Counting Principle? Definition and connection to Sample Space and Tree Diagrams. What is permutation vs. combination, and when do we use them? Students learn what a factorial is through flawless connections to fundamental counting principle and permutations, and how to simplify factorials without us
Subjects:
Grades:
9th - 12th
CCSS:
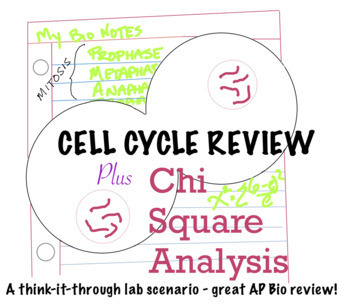
Cell Cycle/Mitosis Scenario with Chi-Square Analysis
What's better than a cell cycle and mitosis review? A cell cycle and mitosis review that also has students complete a chi-squared analysis of data!Students will run through a lab-based scenario to help review the steps of the cell cycle and mitosis. They will also been given data based on this scenario and complete a full chi-squared analysis, including null and alternate hypotheses, using the chi-square critical values table, completing the calculations for chi-squared, and reaching a conclu
Subjects:
Grades:
10th - 12th, Higher Education, Adult Education
Also included in: Cell Cycle/Mitosis and Chi-Squared Analysis Activity and Answer Key
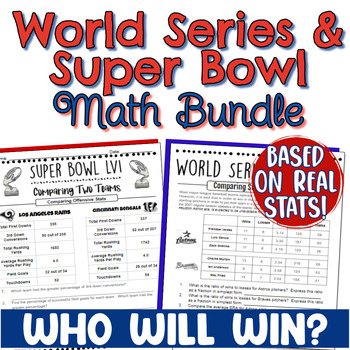
World Series & Super Bowl Math Bundle - Real World Sports Math
Looking for a way to engage your sports lovers in your middle or high school math class? This World Series and Super Bowl Math activity is based on real-world data and statistics, and asks students to determine who will win based on the actual teams.The bundle includes two resources: one for Super Bowl and one for World Series. Each resource is updated yearly to reflect the two teams playing in this year's series or game. The students are asked to make a prediction of the winner after analyzi
Subjects:
Grades:
6th - 9th
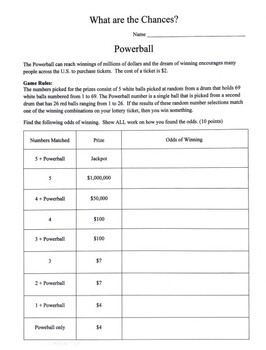
What are the Chances?
Calculate the odds of winning every prize in the Powerball lottery and the Megamillions lottery by using combinations. Determine the amount you will receive after taxes.
Subjects:
Grades:
10th - 12th
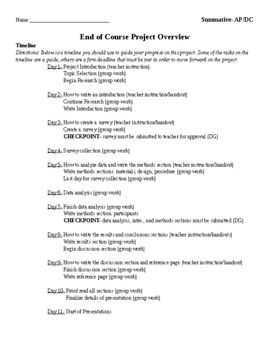
Psychology Research Project
This is a 10-12 day project that allows students to create their own survey research project from start to finish. Recommended for AP or upper level introduction to psychology. Each day is outlined with instructions and an example for students to use as a guide. This is a group project that could easily be used for individuals.
Subjects:
Grades:
11th - 12th
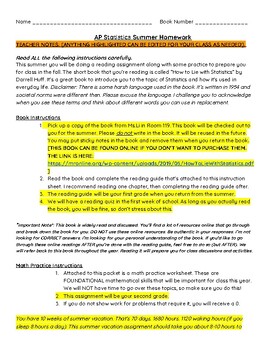
AP Statistics Summer Homework Packet: How to Lie with Statistics by Darrell Huff
Hello! This is a summer homework packet for AP Statistics. The homework consists of two parts: Guided reading questions for the book "How to Lie with Statistics" by Darrell Huff and a foundational math practice portion (it's review for basic math skills that will be used in AP Statistics). There are examples with solutions included in the math portion. If you don't have a physical copy of the book, I attached a free digital copy to the document. The packet is editable, so you may make changes t
Subjects:
Grades:
11th - 12th
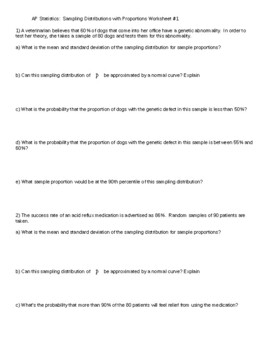
Sampling Distributions With Proportions Worksheet #1
14 question, free-response style worksheet over sampling distributions of p-hat. All original material, not CHEGG-able!! Key Included
Subjects:
Grades:
9th - 12th
Also included in: Confidence Intervals with Proportions Unit
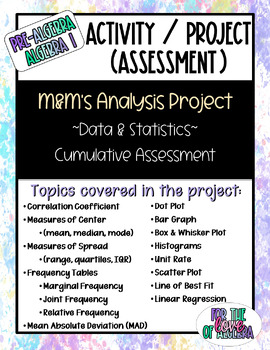
M&M's Analysis Project
This is a culminating project for the end of a unit to use as an assessment. There are 6 different versions included for differentiation as well as convenience.Multiple ways to collect the data for convenience:Teachers can ask students to bring in regular size individual bags of plain M&M's. They will record it on their paper, then share to the whole class to use as "the class" data.Teachers can provide the data to students. There is a completed table full of data from 30 random bags of M
Subjects:
Grades:
8th - 11th
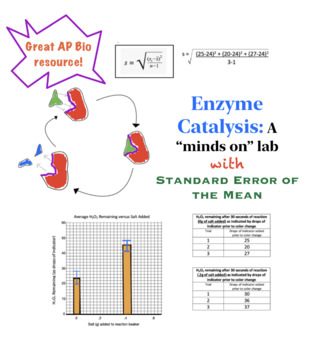
Enzyme Catalysis "Minds-on" Lab with Standard Error of the Mean Review
Use this activity to review an enzyme catalysis lab AND standard error of the mean. This data-driven activity consists of 6 activities that will highlight experimental design, enzyme structure and function, statistical analysis of data, and graphing.The activities are:- Intro and lab overview- Summarizing data - Standard error calculations- Error bars - Graphing- Reaching conclusionsThis is a wonderful activity for absentees during the enzyme catalysis lab and a great AP Bio resource for exam
Subjects:
Grades:
10th - 12th, Higher Education
AP Statistics Summer Assignment
Summer assignment that reviews basic skills necessary for success in AP Statistics. Topics covered: Rounding, Fraction/Decimal/Percent conversions, Summary Statistics (Mean/Median/St. Dev.), Graphing Data (Dotplots/Stemplots), and Box-and-Whisker Plots. Answer key INCLUDED in the back of the packet!
Subjects:
Grades:
10th - 12th
Types:
Probability review presentation - AC Year 9 Maths - Statistics and Probability
This product is compliant with Australian Curriculum version 8.4 and version 9.DescriptionThis presentation helps students review essential probability learning from previous years' maths classes. This is suitable for the teaching and learning of Australian Curriculum Year 9 Mathematics (Statistics and Probability) (v8.4/v9).Buying this presentation will save you around 3 hours of time creating it.SequencingBefore this task: students must interconvert between fractions, decimals and percentages,
Subjects:
Grades:
8th - 10th

Lucky or Genuis? Activity
Article-response activity that explores the idea of Expected Value through a story of people who "gamed" the lottery (that is, turned it from a game with a negative Expected Value for the ticket-buyer into one with a positive Expected Value.)
Subjects:
Grades:
11th - 12th, Higher Education
CCSS:
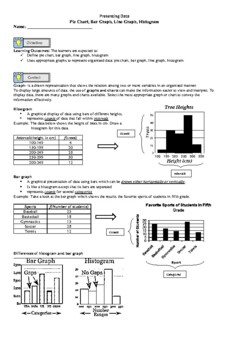
Presenting Data- Bar and Line Graph, Histogram, Pie Chart(Lesson and Activities)
Define pie chart, bar graph, line graph, histogramUses appropriate graphs to represent organized data: pie chart, bar graph, line graph, histogram
Subjects:
Grades:
6th - 10th, Higher Education, Adult Education
Probability Slides and Notes
Check out this set of probability stations- your students will love learning about probability and conditional probability exhibition style! Students can travel from station to station - OR- you can print smaller versions and have the students use the cards as independent centers - OR- you can display the powerpoint slides at individual stations. Student response sheet helps guides students through their learning. Best of all they are learning on their own, and you can skip the lecture! Incl
Subjects:
Grades:
9th - 12th
CCSS:
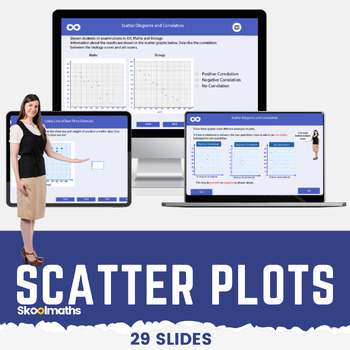
Scatter Plots | Correlation | Line of Best Fit Digital Math Lesson CCSS 8.SP.A.1
Scatter Plots | Correlation | Line of Best Fit Digital Math Lesson CCSS8.SP.A.1Want a high-engagement interactive math lesson that will teach your high school grade how to use and interpret scatter graphs; recognize correlation; draw and use lines of best fit to make predictions?In this lesson, learners will be able to:use and interpret scatter graphs of bivariate data;recognize different types of correlation;draw estimated lines of best fit; anduse lines of best fit to make predictions.The less
Subjects:
Grades:
8th - 10th
CCSS:
Also included in: Complete Statistics and Probability Bundle | Digital and Print
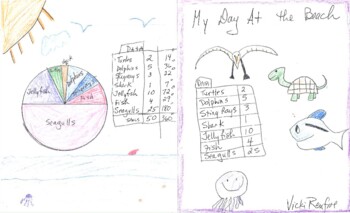
Graphing Project
Graphing Project gives students a random table of data has 7 pieces so that the Q1, Q2, Q3 are all actually in data. Students are then asked to create a box plot, bar graph, and pie chart from the exact same data. Data is put into a booklet that is just a piece of 8.5 x 14 paper folded in half. Rubric, data, keys, and instructions are included. There are 40 tables of random data.
Subjects:
Grades:
7th - 11th
Advanced compound probability presentation - AC Year 9 Maths - Probability
This product is compliant with Australian Curriculum version 8.4 and version 9.DescriptionThis presentation helps students extend compound probability concepts to include dependence and replacement to model more sophisticated and complex scenarios in probability. This is suitable for the teaching and learning of Australian Curriculum Year 9 Mathematics (Statistics and Probability) (v8.4/v9).Buying this presentation will save you around 3 hours of time creating it.SequencingBefore this task: stud
Subjects:
Grades:
8th - 10th
Compound probability presentation - AC Year 9 Maths - Statistics and Probability
This product is compliant with Australian Curriculum version 8.4 and version 9.DescriptionThis presentation helps students explore and understand the formalisms in compound probability concepts, including the application of Boolean logic and various types of diagrams to explain compound probability experiment sample spaces. This is suitable for the teaching and learning of Australian Curriculum Year 9 Mathematics (Statistics and Probability) (v8.4/v9).Buying this presentation will save you aroun
Subjects:
Grades:
8th - 10th
Showing 1-24 of 32 results


