425 results
High school statistics activities $5-10
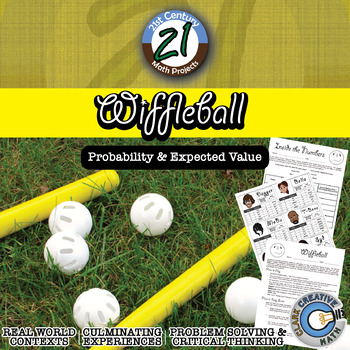
Wiffleball -- Theoretical & Experimental Probability - 21st Century Math Project
Theoretical and Experimental Probability gets a 21st Century Math Project facelift in this interactive game. Tired of flipping coins and spinning spinners? Students play the role of team managers and with only player statistics they must build a team capable of winning the championship. Students will plays a series of Wiffleball games where they will keep track of statistics using a baseball/softball inspired scorebook and after the game crunch the number to see if their players performed up to
Subjects:
Grades:
6th - 12th
Types:
Also included in: Probability & Expected Value Unit Bundle - Distance Learning Compatible
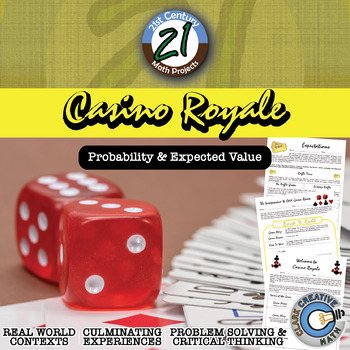
Casino Royale -- Expected Value & Probability Game - 21st Century Math Project
Your students might be begging for for a day for them to play games. Let it be on your terms in this 21st Century Math Project! This Expected Value and Probability Project focuses on one of the more emphasized aspects of the Common Core Standards. Students will be asked to design their own games with defined expected value and host it in a Game Day event! The student that collects the most "Swagg Cash" will forever (or at least for 36 hours) be known as the Master of Swagg. ***THIS PRODUCT HAS B
Subjects:
Grades:
6th - 12th
Types:
CCSS:
Also included in: Probability & Expected Value Unit Bundle - Distance Learning Compatible
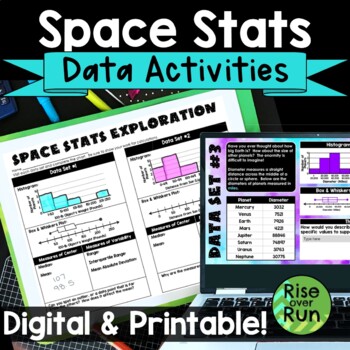
Box and Whiskers Plots and Histograms Activity with Real World Space Statistics
Use statistics for a real world application with this engaging activity about space stats! Students use real data to create histograms, box and whiskers plots, as well as calculate median, mean, range, interquartile range, and mean absolute deviation. This lesson works great for a space room transformation if you choose! Components are included in printable versions for in-person learning and Google Slides + Microsoft PowerPoint for online learning.Here’s what is included:Intro Presentation (Po
Subjects:
Grades:
6th - 9th
Types:
Also included in: Algebra 1 and 8th Grade Math Curriculum Bundle for Entire Year
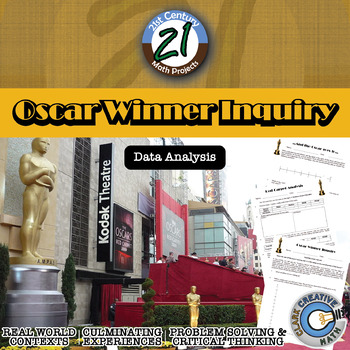
Oscar Winner -- Data Analysis & Statistics Inquiry - 21st Century Math Project
Utilize the last twenty years of Oscar winners as a data set to guide your students through creating box and whisker plots, histograms, and exploring mean, median, and mode -- in one 21st Century Math Project!Does the age of the award winning star in a film relate to the overall gross of the movie? Student will explore this inquiry question and use the data to support their conclusion.In this 8 page document you will be given a mapping to the Content Standards, an outline for how to implement t
Subjects:
Grades:
6th - 12th
Types:
Conditional Probability Two-Way Frequency Tables Scavenger Hunt Activity
Conditional Probability Two-Way Frequency Tables Scavenger Hunt Activity
During this activity, students travel around the room answering conditional probability questions involving two-way frequency tables.
This activity is a great opportunity to group students or let students work with a partner. Students begin by starting at a random station. After a student has found the answer to a station, he will visit the next station using the answer he found. Students continue to move at their own pa
Subjects:
Grades:
6th - 12th
Types:
CCSS:
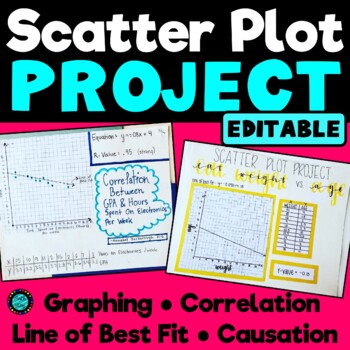
Scatter Plot Statistics Project Correlation Causation Trend Line EDITABLE
A great project to assess students' mastery of scatter plots and bivariant data, correlation coefficient, association, line of best fit, the equation of the line of best fit, and causation. Students are asked to research or collect their own data on the topic of their choice (for example: find the current age and yearly salaries of 10 famous actors, find the height and shoe sizes of 10 different students, or measure the arm span and height of 10 different people). They will display and include
Subjects:
Grades:
7th - 10th
Types:
Analyzing Plots, Graphs, and Tables using Measures of Central Tendency
This product provides students the opportunity to analyze data presented in different ways. By making calculations and analyzing data, students make conjectures and justify them using mathematical reasoning and evidence!What is included?This product contains 8 student work pages. Each work page contains a set of data displayed graphically with accompanying questions. The data displays included are 2 dot plots, 2 bar graphs, 2 frequency tables, and 2 stem-and-leaf plots. Students are required
Subjects:
Grades:
5th - 11th
Types:
Medical Trial -- Statistics & T-Test - 21st Century Math Project
Bring your students into the world of double blind medical studies. Every day, doctors and hospitals rely on scientific studies and research to make healthcare decisions for patients. Are some medicines more effective than others? Do certain types of patients benefit more from certain types of treatments? Due to the security of medical records, studies are somewhat limited in their scope and are generally carried out at universities and research hospitals. At these facilities ground breaking wo
Subjects:
Grades:
8th - 12th
Types:
CCSS:
Correlation All-Star -- Sports Data Analysis - 21st Century Math Project
Bring an authentic sports-based math project to your Algebra, Algebra 2 or PreCalculus classroom with Lines of Best Fit and Correlations! All in this 21st Century Math Project! Using data from the MLB, NBA, NFL and NHL students investigate correlations to some of sports most common questions like: "Do more shots result in more goals?" "Do hitters or pitchers have more impact on a team's wins?""What NFL stat is most strongly correlated with wins?" and the grand-daddy..."Can money buy championship
Subjects:
Grades:
7th - 12th
Types:
CCSS:
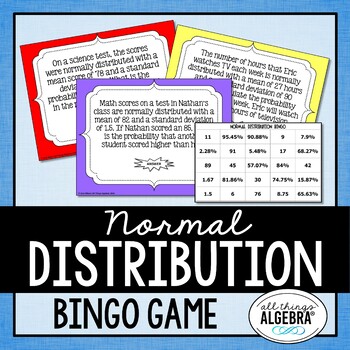
Normal Distribution | Bingo Game
Normal Distribution BingoThis bingo game will help students review problems related to normal distribution, standard deviation, z-scores, empirical rule, and probability under a standard distribution curve. A student worksheet to record work and 30 individual bingo boards are included. Click here for a video preview of the game!This activity works very well in conjunction with my Algebra 2 Probability and Statistics Unit.This resource is included in the following bundle(s):Algebra 2 Activities
Subjects:
Grades:
9th - 12th
Types:
Insurance Actuary -- Expected Value - 21st Century Math Project
Insurance actuaries work hard to analyze risk and make premium recommendations for customers. There is a careful balance between finding an appropriate value based on the risk and creating profit for the insurance company. In this 21st Century Math Project, students where different hats as an actuary to understand insurance!This product includes 4 prep assignments that challenge students in expected value and insurance to build their skills and their thinking for the final project.In this 28 pag
Subjects:
Grades:
8th - 12th
Types:
CCSS:
Also included in: Probability & Expected Value Unit Bundle - Distance Learning Compatible
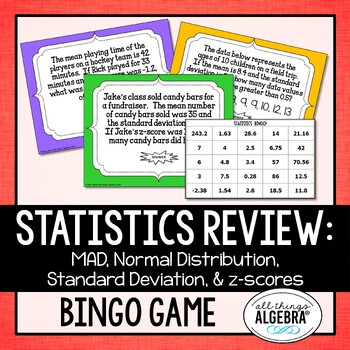
Mean Absolute Deviation, Standard Deviation, Variance, Z-Scores: Bingo Game
Mean Absolute Deviation, Standard Deviation, Variance, Z-Scores: Bingo GameThis bingo game will help students review problems related to mean absolute deviation, standard deviation, variance, and z-scores. A student worksheet to record work and 30 individual bingo boards are included. Click here for a video preview of the game!This resource is included in the following bundle(s):Algebra 1 Curriculum (with Activities)Algebra 1 Activities BundleLICENSING TERMS: This purchase includes a license f
Subjects:
Grades:
8th - 12th
Types:
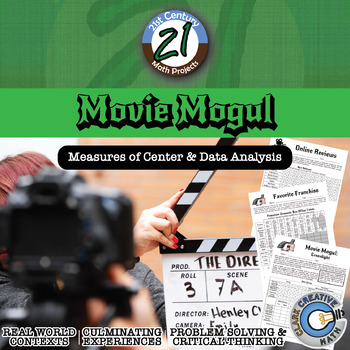
Movie Mogul - Mean, Median & Variation - Project - Distance Learning Compatible
Nowadays online reviews have a huge impact on business. Customer ratings help people decide what to buy and what products to avoid. Movies and entertainment are moving toward the world of intense data analysis of audience views to make business decisions. Companies like Amazon and Netflix have poured resources into developing original content. Let your students sit in the driver's seat! -- and practice Mean, Median and Variation in this 21st Century Math Project!In this 22 page document you will
Subjects:
Grades:
6th - 12th
Types:
CSI: Data Analysis & Probability Activity - Printable & Digital Review Game
Nothing like a good criminal investigation to liven up data analysis and probability! In this project, students will work in teams to investigate the culprit of six fictional thefts. The criminal has left six messages, layered with algebra. Teams will work to build a case and present their findings to the court. Hopefully they are convincing enough to win the verdict.The puzzle solving hook causes many different students to engage in solving traditionally mundane problems. Be the cool teacher :-
Subjects:
Grades:
6th - 12th
Types:
Also included in: Probability & Expected Value Unit Bundle - Distance Learning Compatible
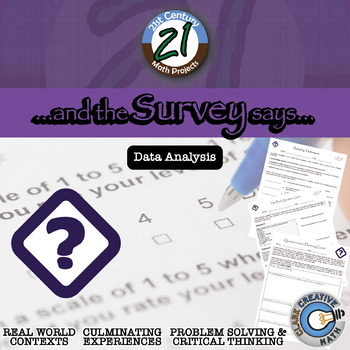
The Survey Says -- Quantitative Questionnaire - 21st Century Math Project
With an influx of data and statistics standards into different levels of the Common Core, a greater emphasis is placed on students understanding data and administering questionnaires (now in the new Algebra 2). This 21st Century Math Project intends to help provide an outline and structure to a project that often has a great deal of freedom with it... perhaps too much freedom.In this project, students will understand different quantitative research question types, critique poorly asked questions
Subjects:
Grades:
7th - 12th
Types:
CCSS:
Examining Effects of Outliers on Measures of Central Tendency
This 10-page document contains 3 real-life data sets. For each data set, students are guided through an exploration of how outliers in data affect mean, median, mode, and range. Each data set requires students to perform calculations and analyze data. Students will make conjectures and justify them in writing using mathematical reasoning and evidence.
At the end of the activity, students are asked several concluding questions that require them to analyze and evaluate their work. They focus
Subjects:
Grades:
5th - 9th
Types:
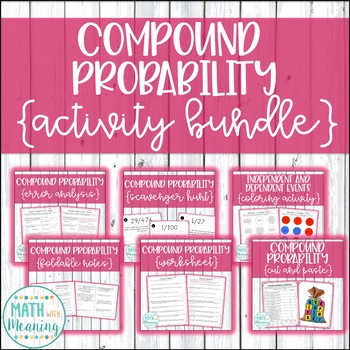
Compound Probability Activity Bundle - Foldable Notes plus 5 Fun Activities
This bundle includes 6 compound probability activities! You will save over 20% by buying this bundle rather than buying each product individually. Please view the individual product descriptions and previews to make sure these activities are appropriate for your classroom.This is a zip file so please be sure you are able to open zip files before downloading this product.***************************************************************************You May Also Like:Theoretical and Experimental Proba
Subjects:
Grades:
6th - 9th
Types:
CCSS:
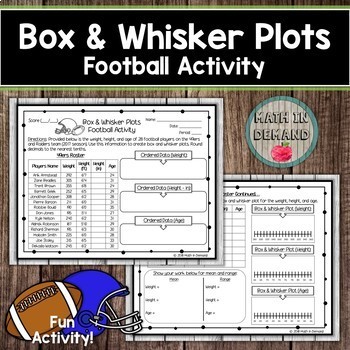
Box and Whisker Plot Football Activity (Statistics & Probability)
Students will be comparing the roster between two football teams: 49ers and Raiders. Students will calculate the mean, median, mode, and range. In addition, students will be creating box and whisker plots from the weight, height, and age given for the football players. Want to see more? Check out the preview!
I also provide an EDITABLE template. You can use the editable template to change the team and player names.
Subjects:
Grades:
6th - 9th
Types:
Chi Squared
Chi SquaredTeaching Chi Squared to a Stats class or AP Bio and not sure where to start?! Well, you found it. I created this product for my husband, who teaching AP Biology. This pack includes a PPT introduction, complete with student fill-in-the-blank notes, that walk students through the steps of Chi Squared and gives them a general overview of how and why we use this test. Degrees of Freedom are explained, as well as p-value. Notes provide an additional practice problem to do as a class. This
Subjects:
Grades:
9th - 12th
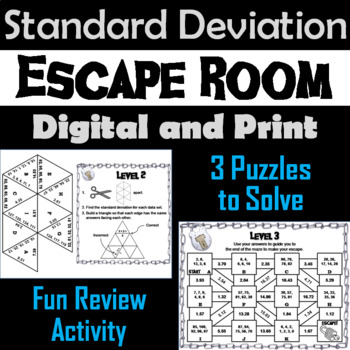
Standard Deviation Activity: Escape Room Algebra Breakout Game (Statistics Unit)
This breakout escape room is a fun way for students to test their skills with calculating standard deviation. Contents: ♦ Teacher Instructions and FAQ ♦ 3 Levels to decode: Multiple Choice, Tarsia Puzzle, and Maze ♦ Student Recording Sheet and Teacher Answer Key ♦ Link to an optional, but recommended, digital breakout roomCheck out the preview and the video preview for more details! - The video preview will show the correct puzzles for this escape
Subjects:
Grades:
8th - 12th
Types:
Set Theory with Venn Diagrams Task Cards Activity (And, Or, and Complement)
Set Theory Task Cards (Using And, Or, and Complement)
These 10 task cards are a fun way for students to practice identifying sets using AND, OR, and COMPLEMENT.
The task cards present sets in a variety of ways. Some cards include lists of numbers, while others include tables or lists of names. For each card, students must create a Venn diagram and answer 1 to 4 questions about the set. The cards get increasingly more difficult as students progress through the 10 cards.
These are the types o
Subjects:
Grades:
6th - 12th
Types:
CCSS:
8th Grade Math Scatter Plot: Guided Interactive Lesson
Extensive ALL digital guided lesson for constructing and interpreting scatter plots.The slides are scaffolded to build understanding. Students will progress from identification of terms to making predictions involving bivariate data. The guided slides will begin with identification, move towards assisted analysis, and conclude with independent practice.Slides include...♦ Definitions and Visual Representations♦ Identification and Use of Terms→ Bivariate Data→ Scatter Plot→ Linear, Nonlinear, &
Subjects:
Grades:
8th - 10th
Types:
CCSS:
Also included in: 8th Grade Math Common Core Growing Bundle
Probability - Tree Diagrams for independent and dependent events
To save you some time when you are preparing your lessons on dependent and independent events, I have collected a bunch of problems that can be solve by drawing tree diagrams and made a slide show of the questions and there answers. The tree diagrams are animated to enable you to explain as you go on. They can also be adjusted very easily and quickly to fit any other problems that you want you learners to solve.There are 6 examples of dependent events and 9 of independent events. I have also inc
Subjects:
Grades:
7th - 12th
Food Waste and Mathematics: From Farm to Table to Dump
Here's a very uncomfortable fact: it takes 4 pounds of potatoes to make 1 pound of potato chips. That means that for every 1 pound bag of potato chips you eat, 3 pounds of potatoes have to be thrown away. What a waste of food! This is a series of activities that looks at the hidden world of food waste. It includes a look at how much food is wasted as it is "processed" into finished products like french fries and potato chips. It also includes mathematical activities where students calculate how
Subjects:
Grades:
5th - 12th, Adult Education
Types:
Showing 1-24 of 425 results


