292 results
High school statistics worksheets $5-10
Analyzing Plots, Graphs, and Tables using Measures of Central Tendency
This product provides students the opportunity to analyze data presented in different ways. By making calculations and analyzing data, students make conjectures and justify them using mathematical reasoning and evidence!What is included?This product contains 8 student work pages. Each work page contains a set of data displayed graphically with accompanying questions. The data displays included are 2 dot plots, 2 bar graphs, 2 frequency tables, and 2 stem-and-leaf plots. Students are required
Subjects:
Grades:
5th - 11th
Types:
Examining Effects of Outliers on Measures of Central Tendency
This 10-page document contains 3 real-life data sets. For each data set, students are guided through an exploration of how outliers in data affect mean, median, mode, and range. Each data set requires students to perform calculations and analyze data. Students will make conjectures and justify them in writing using mathematical reasoning and evidence.
At the end of the activity, students are asked several concluding questions that require them to analyze and evaluate their work. They focus
Subjects:
Grades:
5th - 9th
Types:
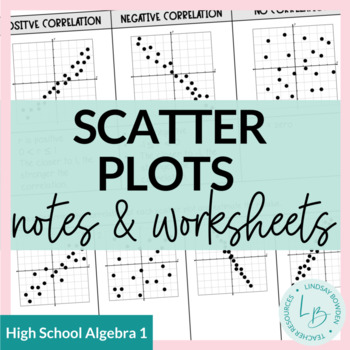
Scatter Plots Notes and Worksheets
These scatter plots notes and worksheets are meant for an Algebra 1 statistics unit. They cover:Linear, Quadratic, and Exponential Scatter Plots (very basic)Linear Scatter Plots in more detail Correlation CoefficientCorrelation vs. CausationLine of Best Fit (estimating from a graph)Linear Regression (using a graphing calculator)10 pages + answer keys.You may also like:Box and Whisker Plots Notes & WorksheetsHistograms Notes & WorksheetsTerms of Use:This product should only be used by the
Subjects:
Grades:
8th - 10th
CCSS:
Also included in: Statistics Unit Bundle
Compound Probability Activity Bundle - Foldable Notes plus 5 Fun Activities
This bundle includes 6 compound probability activities! You will save over 20% by buying this bundle rather than buying each product individually. Please view the individual product descriptions and previews to make sure these activities are appropriate for your classroom.This is a zip file so please be sure you are able to open zip files before downloading this product.***************************************************************************You May Also Like:Theoretical and Experimental Proba
Subjects:
Grades:
6th - 9th
Types:
CCSS:
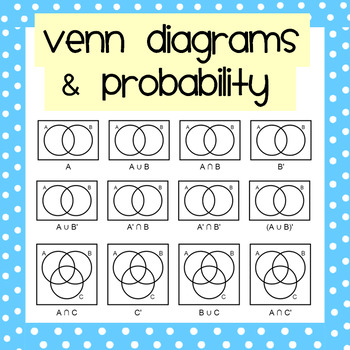
Venn Diagrams & Probability Mega Worksheet Pack
A thorough introduction to shading regions of venn diagrams and using them to calculate probabilities.
Includes 7 worksheets/activities:
1. Understanding intersections, unions and complements of sets.
2 & 3. Probabilities from Venn diagrams: True or False & Matching Questions.
4. Comparing Venn Diagrams, Two-way Tables & Frequency Trees.
5. Completing Venn Diagrams from given information (more difficult).
6. Venn Diagrams & Conditional Probability
7. Recognising exhaustive,
Subjects:
Grades:
9th - 12th
Types:
CCSS:
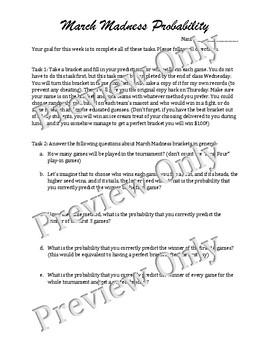
March Madness Probability Project
In this project, students will fill in NCAA March Madness brackets and then analyze them using historical data to find the probability of different outcomes. They will also use a random number table and the historical results of the tournament to fill out a mathematical bracket. This project is perfect if you can time your lessons on probability with the March Madness tournament.
Subjects:
Grades:
7th - 12th
Types:
CCSS:
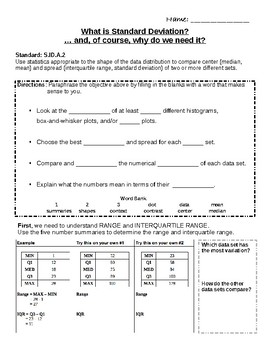
What is Standard Deviation? … and, of course, why do we need it?!
S.ID.A.2 Use statistics appropriate to the shape of the data distribution to compare center (median, mean, mode) and spread (range, interquartile range, variance, and standard deviation) of two or more different sets.
Subjects:
Grades:
7th - 11th
CCSS:
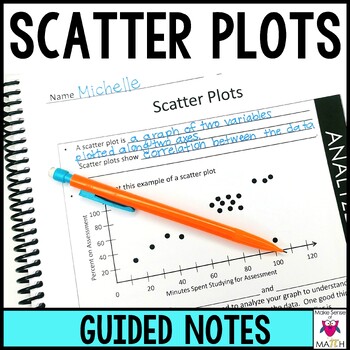
Scatter Plots Guided Notes - Scatter Plots and Line of Best Fit Notes
Save some time with these scatter plots guided notes that dive into correlations, linear associations, outliers, clusters, lines of best fit, and construction of scatter plots. These are perfect for 8th grade math or Algebra class. Your students will have a great undrstanding of scatter plots after going through these notes. IF YOU LIKE THESE NOTES THEN CHECK OUT ALL 8TH GRADE NOTES HERE!These in-depth guided notes contain:1 title page14 pages of guided notesCONTAINS 2 FORMATS: ONE WITH A BLACK
Subjects:
Grades:
8th - 9th
Also included in: 8th Grade Math Curriculum and Activities Bundle CCSS
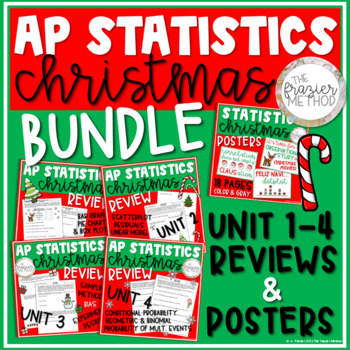
AP Statistics Christmas Posters & Reviews - Boxplot Scatterplot Probability Bias
AP Statistics Christmas Unit Reviews on box plots, bar graphs, scatterplots, linear models, residual plots, sampling methods, bias, experiment design, compound probability of multiple events, conditional probability, geometric & binomial distributions, and more! Use these four worksheets as a SUB PLAN, classwork the week before Christmas, homework over Christmas break, or quizzes when your students return from the holidays! The Statistics Christmas Posters will add fun holiday décor to your
Subjects:
Grades:
10th - 12th
Types:
Confidence Intervals and Hypothesis Testing Worksheet Bundle
Elementary Statistics - Confidence Intervals and Hypothesis Testing Worksheet BundleGreat worksheets for Substitute Plans!Answer Keys IncludedThis bundle includes the following worksheets:-Confidence Intervals for the Mean-Confidence Intervals for Proportions-Confidence Intervals for Variance and Standard Deviation-Introduction to Hypothesis Testing-Hypothesis Testing for the Mean-Hypothesis Testing for Proportions-Hypothesis Testing for Variance and Standard Deviation-Other Uses of Hypothesis T
Subjects:
Grades:
10th - 12th, Higher Education
Types:
Also included in: Elementary Statistics Worksheets - Full Course Bundle
Make It Real: Sets, Probability, Statistics 1 - Activity Collection
"When am I ever going to use this?"
It is a question that has plagued math teachers for decades. Now you can answer the question.
The Make It Real Learning Sets, Probability, Statistics 1 collection contains 10 real-world math activities that demonstrate everyday applications of mathematics. From Menu Choices to Rolling the Dice, the activities provide learners with valuable life skills in addition to mathematical understanding. Rest assured that each activity integrates real world information
Subjects:
Grades:
9th - 12th, Higher Education
Types:
Probability Boot Camp - Printable & Digital Differentiated Practice Activity Set
Take your class to Probability Boot Camp!At times, I was frustrated teaching more challenging content when it was obvious many in the class needed extra help on easier stuff. I developed this idea of a Boot Camp to reinforce those skills, but allowing others to accelerate on their own!Students will take a Pre-Assessment and will be assigned a level. Each level is thematically tied with a rank in the Army. So while the Levels of the problems get more challenging, they achieve a higher rank in the
Subjects:
Grades:
6th - 12th
Types:
Also included in: Probability & Expected Value Unit Bundle - Distance Learning Compatible
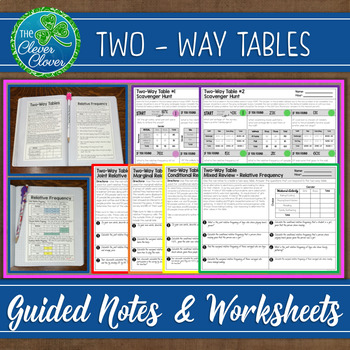
Two - Way Tables - Notes and Worksheets
This two-way table resource includes guided notes, practice worksheets and two scavenger hunts. Your students will have the opportunity to create, interpret and discuss two-way tables. Below, you will find a detailed description of the notes, worksheets and scavenger hunts.
Guided Notes
There are three half pages of guided notes on two-way tables. The first page of notes provides the definition of a two-way table. Next, students can use step by step directions on how to create a two-way table.
Subjects:
Grades:
7th - 10th
CCSS:
Also included in: Statistics Bundle - Guided Notes, Worksheets & Scavenger Hunts!
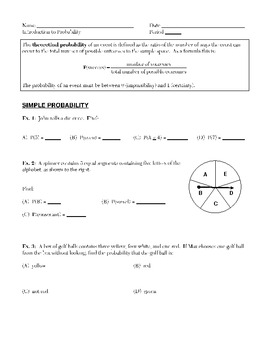
Basic Probability and Statistics
This a unit bundle of handouts/worksheets that can be used as lessons. This unit is most likely usable in an Algebra 1 course that studies one unit of basic probability and statistics. Students start off learning basic probabilities and then delve into compound probabilities (those involving AND and OR statements). Students then work with the counting principle and construct tree diagrams and/or list sample spaces to find the probabilities of compound events. The second half of the unit has
Subjects:
Grades:
7th - 12th
Types:
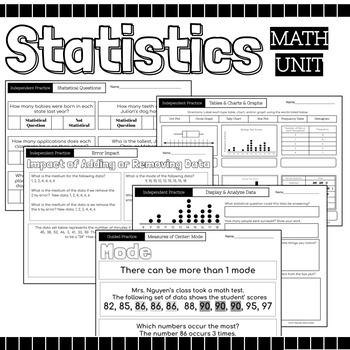
Statistics Math Packet {Data, Charts, Graphs, Mean, Median, Mode, Range, Spread}
52 Page Statics Unit Includes: Guided Instruction & Independent Practice Pages Usage Suggestions and IdeasThis resource can be utilized in numerous ways, here are some ideas:use for guided practiceassign as partner workassign as independent practicecan be used for morning workuse for reteaching in small group settinguse as review prior to assessmentuse as review in continuing to strengthen skillassign for homeworkuse as independent work during math centersTopicsRecognize Statistical Question
Subjects:
Grades:
4th - 12th
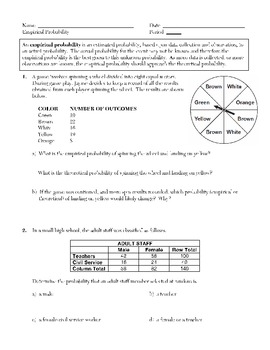
Probability and Counting (Permutations and Combinations)
This is a unit bundle of handouts/worksheets that can be used as lessons most likely for an Algebra 2 course or even a basic statistics course. The unit starts out with lessons on theoretical, empirical, and geometric probabilities. Students then investigate what permutations and combinations are as well as a mixed lesson on identifying which is which. Using their knowledge of combinations, students can then calculate binomial probabilities (including examples asking for exact probabilities as
Subjects:
Grades:
9th - 12th
Types:
Baseball Statistics Project - Histograms, Box-and-Whisker, and Frequency Tables
Capture your sports fanatic students in this fun baseball statistics project! All stats in this project are accurate to the 2023 MLB season, for five teams. Students will compare and analyze different baseball statistics for 5 real MLB teams, by creating box-and-whisker plots, frequency tables, histograms, and two-way tables. Each section of the project can be done multiple times as the students choose different teams to compare. See preview for all thats included!
Subjects:
Grades:
6th - 9th
Types:
Also included in: Real Life Math Project Based Learning PBL - Bundle
Introduction to Probability and Statistics Worksheet Bundle
Elementary Statistics - Introduction to Probability and Statistics Worksheet BundleGreat worksheets for Substitute Plans!Answer Keys IncludedThis bundle includes the following worksheets:-Introduction to Statistics and Types of Data-Data Collection, Sampling Techniques, and Studies-Organizing Data Using Frequency Distributions-Histograms and Dot Plots-Graphs and Charts in Statistics-Measures of Central Tendency-Measures of Position-Measures of Variation-Introduction to Normal Distribution and St
Subjects:
Grades:
10th - 12th, Higher Education
Types:
Also included in: Elementary Statistics Worksheets - Full Course Bundle

Cell Cycle/Mitosis and Chi-Squared Analysis Activity and Answer Key
Answer key and activity packet included!What's better than a cell cycle and mitosis review? A cell cycle and mitosis review that also has students complete a chi-squared analysis of data!Students will run through a lab-based scenario to help review the steps of the cell cycle and mitosis. They will also been given data based on this scenario and complete a full chi-squared analysis, including null and alternate hypotheses, using the chi-square critical values table, completing the calculations f
Subjects:
Grades:
9th - 12th, Higher Education, Adult Education
Types:
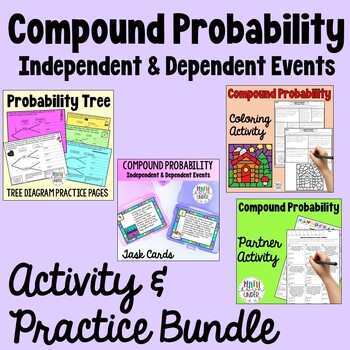
Compound Probability Activity & Practice Bundle
Grab a bargain with this bundle of four fun and engaging activities for Compound Probability - including Independent and Dependent EventsIncluded:-Coloring Activity-Task Cards / Scavenger Hunt-Partner Activity-Plenty of Practice PagesTake a closer look in the preview files!
Subjects:
Grades:
7th - 9th
Types:
CCSS:
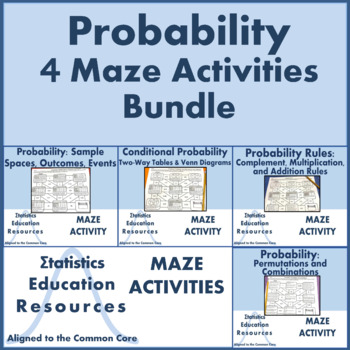
Probability Maze Activities Bundle (4 Activities) (Common Core Aligned)
This bundle includes 4 self-checking worksheets on probability. Students practice solving problems on sample spaces, conditional probability, probability rules, permutations, and combinations in these maze activities. Students use both computation and contextual interpretation to solve problems. Students follow a maze to the finish line by correctly answering the questions. Possible paths provide an answer bank and an opportunity for self-checking. This fun twist on worksheets engages students b
Subjects:
Grades:
9th - 12th
Types:
CCSS:
Measures of Center Boot Camp - Printable & Digital Practice Activity Sets
Take your class to Measures of Center Boot Camp!At times, I was frustrated teaching more challenging content when it was obvious many in the class needed extra help on easier stuff. I developed this idea of a Boot Camp to reinforce those skills, but allowing others to accelerate on their own!Students will take a Pre-Assessment and will be assigned a level. Each level is thematically tied with a rank in the Army. So while the Levels of the problems get more challenging, they achieve a higher rank
Subjects:
Grades:
6th - 12th
Types:
Also included in: Measures of Center & Variance Unit Bundle - Distance Learning Compatible
Normal Distribution
Highly engaging activities! The students will start by understanding how to label a normal curve with mean and standard deviation, shade desired areas and use the empirical rule to estimate the area. Then, once the standardize score is learned, students can practice finding exact area.
Subjects:
Grades:
9th - 12th
Types:
CCSS:
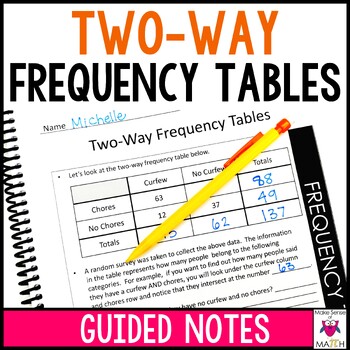
Two-Way Frequency Tables Notes
Save some time with these two-way frequency tables guided notes that delve into creating frequency tables and relative frequency tables based on rows and columns. As well as interpreting relative frequency tables for associations between bivariate categorical data.These in-depth guided notes contain:1 title page9 pages of guided notesCONTAINS 2 FORMATS: ONE WITH A BLACK STRIP AND AN INK SAVING WHITE STRIP2 pages of additional practice (10 problems)1 lined page for extra notesTeacher Tips PageCom
Subjects:
Grades:
8th - 9th
CCSS:
Also included in: 8th Grade Math Curriculum and Activities Bundle CCSS
Showing 1-24 of 292 results


