
Statistics:Representing & Interpreting Data (Histogram, Box Plot, Dot Plot)


- Zip
What educators are saying
Also included in
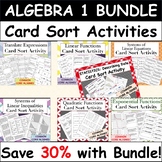 This Common Core Algebra 1 Bundle includes 7 Card Sort Activities:1) Statistics: Representing and Interpreting Data 2) Exponential Functions3) Quadratic Functions4) Systems of Linear Inequalities5) Systems of Linear Equations6) Linear Functions7) Translate ExpressionsStudents work collaboratively tPrice $29.37Original Price $41.95Save $12.58
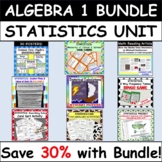 This Statistics Unit Bundle set includes a wide variety of 10 resources all geared towards the Common Core Algebra 1 course.Resources Included:Culminating Project Based on Real World Data30 PostersCard Sort ActivityMath Reading Article & Follow Up SummaryTask Cards ActivityFoldableMystery ColorPrice $36.33Original Price $51.90Save $15.57
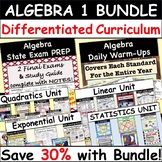 The Common Core Algebra 1: Curriculum Set includes 59 differentiated resources and learning activities designed to engage students. The curriculum set is aligned to the Common Core standards which are outlined in the lesson plans for each resource. The Ultimate package for projects, vocabulary activPrice $213.36Original Price $304.80Save $91.44
Description
Complete Lesson! This lesson features a 40 CARD SORT, Differentiated Cornell Notes, Distribution Shapes Graphic Organizer, and Power Point to go with the notes! Perfect for the inclusive classroom!
Within the Card Sort Activity there are 5 categories of cards to match:
1) Histogram
2) Frequency Display (including Dot Plots, Frequency Line Graphs and Tables)
3) Box Plots
4) Describing Shape
5) Describing Measures of Center & Spread.
With 8 different sets of matches, there are 40 cards total. Students work to sort and group the cards. Recording sheet and follow-up questions to the activity are provided!
Skills:Students will learn how to create histograms, box plots, dot plots. They will also learn how to describe data using shape, center, and spread.
Differentiation: The Cornell notes are tiered into 2 levels of difficulty, one where the notes are filled in, one where the notes are blank. Both sets have to write in the notes for examples. The 40 Card Sort Activity is differentiated by use of heterogeneous groups with assigned roles. Directions to differentiate the groups are in the lesson plan!
Common Core Standard:
CCSS.HSS.ID.A.1 Represent data with plots on the real number line (dot plots, histograms, and box plots).
CCSS.HSS.ID.A.3 Interpret differences in shape, center, and spread in the context of the data sets, accounting for possible effects of extreme data points (outliers).
Answer key included.
See similar resources:
Statistics:Measures of Center and Spread TASK CARDS
Statistics: 2 Way Frequency Tables BINGO GAME
Statistics: Scatter Plots and Lines of Best Fit FOLDABLE
Statistics: Math Article (Case Studies of Bad Graphs found in the Media)
Statistics Project: U.S. Home Energy & Tax Themed Analysis of Real-World Data
Statistics: Vocabulary Activities
Statistics: Line of Best Fit MYSTERY ACTIVITY (FREE!)
This topic is also covered in:
Algebra State Exam Prep: Study Guide w/ Notes and 2 Practice Tests
Algebra Warm-ups/ Bellringers/ Exit Tickets- COMMON CORE ALIGNED
Algebra Curriculum Vocabulary Bundle: Matching Card Sets & Vocabulary Puzzles
Common Core Algebra 1 Full Curriculum POSTERS
*Purchase of this product provides one (1) purchaser the rights for solely personal classroom use. Posting any part of this publication on the Internet in any form, including classroom websites, is strictly prohibited and in violation of the Digital Millennium Copyright Act. To share this resource with colleagues, please purchase additional licenses. Inquire to mathbyrd@gmail.com for discounted multiple license purchases. All clip art images are from pixabay.com; all other images are original creations by the author.
