68 results
Adult education statistics centers
BACK TO SCHOOL STEM ACTIVITY: Spaghetti Marshmallow Challenge
Don't miss out on this wonderful opportunity for your students to work collaboratively, problem-solve, show creativity and use their math skills! This Spaghetti Marshmallow Challenge cost me less than $2.00 for all supplies but delivers such a big bang for the buck! Fun for students K-12 (they say that the kindergarteners actually build the highest!). Enjoy!
Subjects:
Grades:
PreK - 12th, Higher Education, Adult Education, Staff
Types:
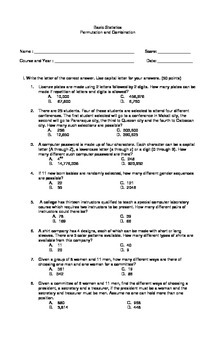
Probability and Statistics Multiple Choice on Permutation and Combination
Grab this Worksheet! a 25 multiple choice questions on probability's Permutation and Combination that will enhance and gain student's understanding on the topic!you can have this as a quiz or as a practice exercises in your class! a must have!!Viva Math!
Subjects:
Grades:
9th - 12th, Higher Education, Adult Education
Types:
Data Analysis Statistics and Probability worksheets (63 Problems) (SAT Review)
Data analysis statistics and probability worksheets ,63 problemsSAT ReviewFraction and Data (29 Multiple choice questions)Statistic Problem (15 questions)Probability Word Problems This section contains 19 word problems about :Simple ProbabilityCounting PrincipleIndependent ProbabilityDependent ProbabilityMutually Exclusive EventsPermutationsCombinationsConditional Probability* AlSO AVAILABLE FOR YOU OR A COLLEAGUE! - CLICK ANY LINK YOU WANT:Number and Operations (SAT Review) Algebra & Functi
Subjects:
Grades:
7th - 12th, Higher Education, Adult Education, Staff
Types:
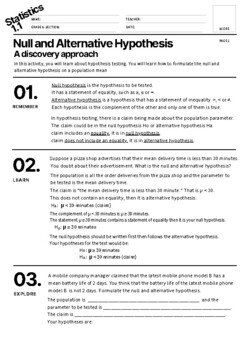
Statistics Null and Alternative Hypothesis Discovery approach
Having difficulty in teaching Null and Alternative Hypothesis?Does your student still confuse how to formulate the null and alternative hypothesis? Grab this Lecture- Activity -Quiz all in one all about how to formulate the null and alternative hypothesis.This includes, all the important points to remember. Easy to understand and student's learn it by discovering the meaning and concept by following this activity all through out.You don't need to teach long and keep on repeating for students who
Subjects:
Grades:
9th - 12th, Higher Education, Adult Education
Types:
Permutations and Factorial Notation Worksheet (17 Questions)
Permutations and Factorial Notation Worksheet17 Questions with the solutions1 page for the questions1 page for the answers* AlSO AVAILABLE FOR YOU OR A COLLEAGUE! - CLICK ANY LINK YOU WANT:Probability & OddsMean, median, mode, range, line plot, and Box and whisker WorksheetStatistical Math (GED REVIEW)The Binomial Theorem Worksheet (10Q)Theoretical Probability WorksheetProbability Word Problems (Worksheet) You may also be interested in my other top-selling products: EQUIVALENT FRACTIONS (33
Subjects:
Grades:
9th - 12th, Higher Education, Adult Education, Staff
Types:
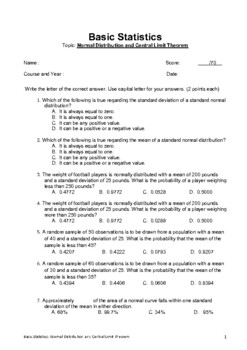
Statistics Multiple Choice Quiz: Normal Distribution and Central Limit Theorem
Basic StatisticsThis quiz covers:- Normal Distribution- Central Limit TheoremThis quiz contains 35 multiple choice questionsThe 35 multiple choice questions covers about terms, definition and calculations about Normal distribution and Central Limit Theorem.The questions in terms and definition in this multiple choice are simple this will test the understanding of students if they understand the concept of Normal Distribution and Central Limit Theorem.I have provided an answer key in this multipl
Subjects:
Grades:
8th - 12th, Higher Education, Adult Education
Types:
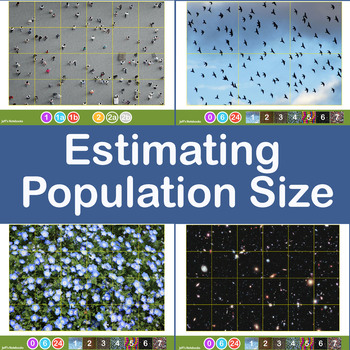
Estimating Crowd and Population Size using Jacob's Method
This investigation delves into estimating the size of a large population of objects by taking a sample and applying some basic mathematics. It encourages sharing of data, refining methods of collection of the data and discussion about the accuracy and limitations of the method used.Jacob's Method of counting large numbers of objects is simple. Draw a grid dividing the area covered into equal size squares. Estimate (by counting) the population of one grid then multiply this by the number of squar
Subjects:
Grades:
6th - 11th, Higher Education, Adult Education
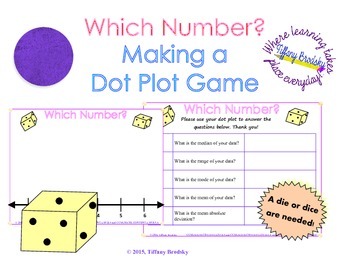
Dot Plot Graphing and Worksheet Activity (or Game)
A fantastic activity for practice after teaching mean, median, range, and mean absolute deviation. Students roll a die and plot their own graphs. Wonderful! What's Included:PDF for easy printing (color and black and white copy; you choose the best for printing)activity formatted for Easel (this is a pen activity)(You will need one die per person or group. This is not included.)This is an activity which you can simply print and set in a math center or give as an assignment. This game or activ
Subjects:
Grades:
5th - 7th, Adult Education
Types:
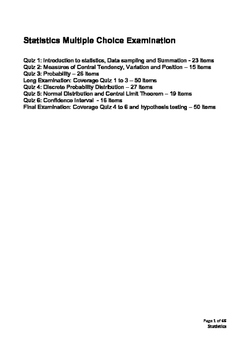
Statistics Multiple Choice Exams complete Quiz 1 to 6 plus final exams
This is a collection of 6 statistics exams plus two long exams which can be used as final examination.I believe this exam would help your math class especially the low achievers. It is designed as clearly as possible and easy for students to understand and give them a meaningful understanding toward statistics as a subject.The exams are in multiple choice exam type except for two which i have added a matching type after the multiple choice part.Below is the summarize of the topics which are incl
Subjects:
Grades:
7th - 12th, Higher Education, Adult Education
Types:
Percentage Guide with 30 Printable Activities
This 152 page book is all about percentages (No shock there). It is divided into two parts: Percentage Guide and Printable Percentage Puzzles/Games/Activities.The Guide portion of the book has notes and examples of different situations involving percentages. There is a premium on using an algebraic approach to solving problems in this guide, but different methods are also used. The following are the sections of this guide:Percentage HIstoryPercentage, Fraction, & Decimal ConversionModeling P
Subjects:
Grades:
5th - 12th, Adult Education
Types:
Centimeter & 1 Inch Grid Papers (Full Sheets Each)
A full sheet of Centimeter Grid Paper and a full sheet of 1 inch Grid Paper all contained in one easy to transport/store .pdf. You can use these sheets with making charts, plotting points, etc... Enjoy and thank you for your support.
Subjects:
Grades:
PreK - 12th, Higher Education, Adult Education, Staff
Types:
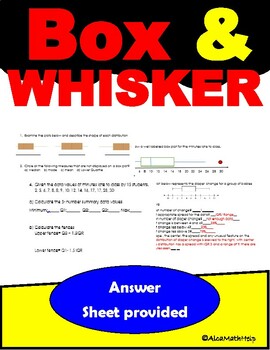
Statistics Quantitative Data Boxplots- 5 Number Summary Data CP, AP Stats
If you are looking for an activity sheet that will engage students as they aim to practice and apply taught concept this box plot activity is the one. It is excellent if you want to check students understanding while having fun. This activity helps students to describe the shape of quantitative distribution, identify centers and spreads by analyzing quartiles (measure of center and variability) . Use the SOCS method to describe the shape, center, spread and outlier as well as other unusual feat
Subjects:
Grades:
7th - 12th, Higher Education, Adult Education
Types:
CCSS:
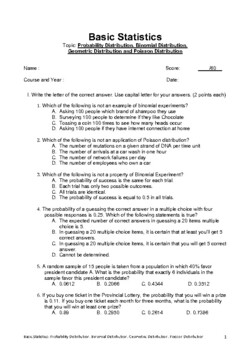
Statistics Multiple Choice Quiz: Binomial, Geometric & Poisson Distribution
Basic StatisticsThis quiz covers:- Probability Distribution- Binomial Distribution- Geometric Distribution- Poisson DistributionThis quiz has multiple choice on test 1 (19 questions) and a matching type on test 2 (11 question)The 19 multiple choice questions covers about terms, definition and computation about probability distribution, binomial distribution, geometric distribution and poisson distribution while the 11 matching type question is matching the type of distribution as Binomial, Geome
Subjects:
Grades:
8th - 12th, Higher Education, Adult Education
Types:
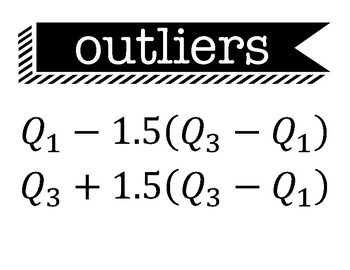
AP Statistics Formula Posters
These pages contain a great way to display the formulas students are required to know for the AP Statistics exam. These can be printed on 8.5"x11' paper and displayed in your classroom! This product contains 14 pages with the following formulas and definitions:OutliersResiduals, Standard score,Combining mean and variance,Converting mean and variance, Geometric Probability and mean,exponential and power model, definitions for confidence level, p value, and r squared
Subjects:
Grades:
9th - 12th, Higher Education, Adult Education
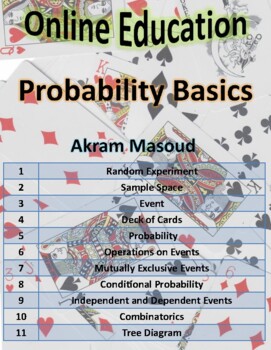
Probability Basics
This resource is a free small notebook for teaching the basics of the probabilities for high school and colleges. The resource is a PDF of nine pages and contains 11 different subjects supported by figures and solved examples. The subjects are:Random Experiment.Sample Space.Event.Deck of Cards.Probability.Operations on Events.Mutually Exclusive Events.Conditional Probability.Independent and Dependent Events.Combinatorics.Tree Diagram.If required, I am entirely ready to prepare a low price comple
Subjects:
Grades:
11th - 12th, Higher Education, Adult Education, Staff
Types:
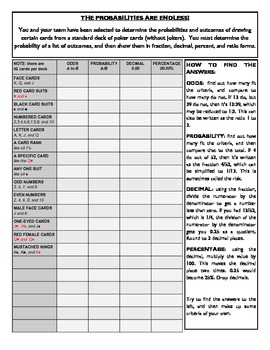
Math Lab on ratios, fractions, percentages, and decimals with playing cards
This lesson showcases how ratios, fractions, decimals, probabilities, and percentages are all similar ways of looking at the same thing. By using a deck of playing cards, a team can search for the chances of pulling out a face card, a numbered card, a red face card, an odd numbered card, and many more... there is also room for a few of your own combinations.
There is a brief explanation on how to find each of the different statistics in the margin, and you can check the answers on the second p
Subjects:
Grades:
4th - 12th, Higher Education, Adult Education
Types:

Statistical Math (GED REVIEW)
Statistical Math
Data analysis statistics and probability worksheets ,63 problems
GED Review
Fraction and Data (29 Multiple choice questions)
Statistic Problem (15 questions)
Probability Word Problems
This section contains 19 word problems about :
Simple Probability
Counting Principle
Independent Probability
Dependent Probability
Mutually Exclusive Events
Permutations
Combinations
Conditional Probability
* AlSO AVAILABLE FOR YOU OR A COLLEAGUE! - CLICK ANY LINK YOU WANT:
Geometry (GED R
Subjects:
Grades:
9th - 12th, Higher Education, Adult Education, Staff
Types:
Statistics Topic Six - Normal Distribution and Central Limit Theorem
Here's the Sixth Topic in Statistics Powerpoint LectureStatistics Lecture SixIn this Powerpoint topics are Normal Distribution and Central Limit Theorem. It gives a nourishing lecture about Normal distribution, how to convert values to z-score, how to find area and probability under the normal curve when to use Central Limit theorem and the theorem behind it.Each topic is summarized and easy to understand, rather letting your students read the statistics book. This powerpoint is not wordy it giv
Subjects:
Grades:
8th - 12th, Higher Education, Adult Education
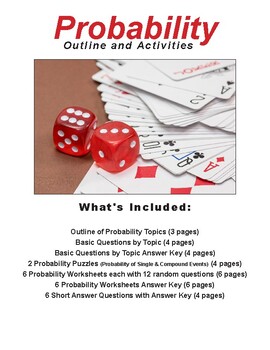
Probability Packet- Guide and Activities
This 30 page Probability Guide & Activities is packed with over 150 probability problems. This packet is geared for middle school, but can certainly be used as a review for high school or an introduction for upper elementary grades.Topics Covered:Writing Probability as fractions, decimals, or percents.Basic Probability TermsUsing Number Lines with ProbabilityTheoretical and Experimental Probability Simple and Compound EventsModeling Probability with Frequency Tables, Organized List & Tre
Subjects:
Grades:
6th - 10th, Adult Education
Types:
7th Grade Math Summer Packet or Test Prep
This is a 349 page review of 7th grade math. This is a power point presentation and can be printed for students to practice over the summer by choosing several slides to print on each page of the booklet. There are several problems per page with the answers popping in on the next page for a quick check as students work. These can also be used as task cards, warm ups, or homework throughout the year. The layout is as follows:Operations with Rational Numbers - 30 daysExpressions and Equations
Subjects:
Grades:
4th - 10th, Adult Education
Types:
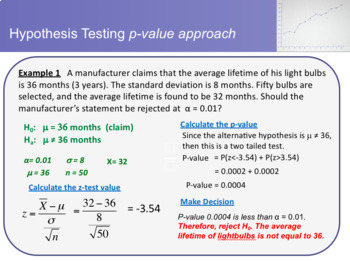
Statistics Topic Nine - Hypothesis Testing with two samples
Here's the Ninth Topic in Statistics Powerpoint LectureIntensive and easy approach in learning hypothesis testing with two samples : 35 slides in all(topics:Large Independent SamplesSmall Independent SamplesDifference between means Dependent SamplesDifference between ProportionsStatistics Lecture NineIn this Powerpoint it discuss how to do Hypothesis Testing with two samples.(2(1) How to decide whether two samples are independent or dependent(2) How to perform a two sample z-test for difference
Subjects:
Grades:
9th - 11th, Higher Education, Adult Education
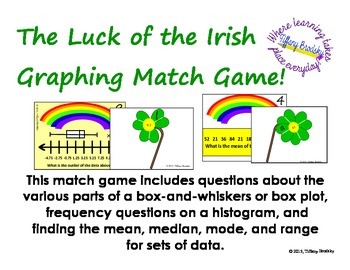
St. Patricks Day Luck of the Irish Graphing Match Game: mean, box plot, etc.
This St. Patrick's Day match game includes questions about the various parts of a box-and-whiskers or box plot, frequency questions on a histogram*, and finding the mean, median, mode, and range for sets of data. An answer key is included so you or students can check their answers thereafter. (A simple worksheet is included to have students write their answers on if you would like them to.)May you and your students enjoy!* This is about a biology test with very unusually high point values.
Subjects:
Grades:
5th - 7th, Adult Education
CCSS:
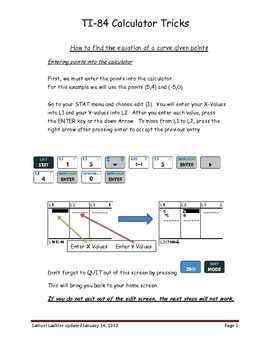
Regressions using the TI84 graphing calculator
Some questions in algebra and algebra 2 will ask for the equation of a curve or correlation coefficient. The r-value number describes both how well the equation of the curve fits and whether the graph is increasing or decreasing. The r- value will be positive if the graph is increasing and the r-value will be negative if the graph is decreasing. The closer the absolute value of r is to 1, the better the curve fits the data. An r-value of 1 means the curve fits the data perfectly and has a positi
Subjects:
Grades:
8th - 12th, Higher Education, Adult Education, Staff
Types:
Visual Probability
Use Visual Probability to compute and graph probability density function values, cumulative distribution function values, quantile values, means and variances of ten more distributions.
Subjects:
Grades:
Higher Education, Adult Education, Staff
Types:
Showing 1-24 of 68 results


