230 results
Adult education statistics worksheets
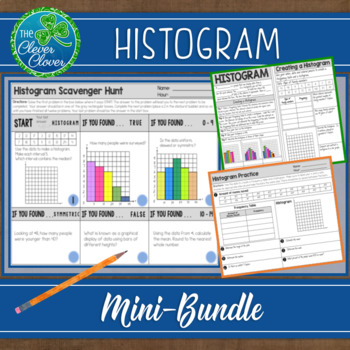
Histogram - Notes, Practice Worksheets and Scavenger Hunt
This histogram resource includes guided notes, a practice worksheet and a scavenger hunt. Your students will have the opportunity to create, interpret and discuss histograms. Below, you will find a detailed description of the notes, worksheet and scavenger hunt. Guided NotesThere are two small pages of guided notes. The first page provides the definition of a histogram and step by step instructions on how to create a histogram. The bottom portion of the notes has students examine three types (un
Subjects:
Grades:
6th - 9th, Adult Education
CCSS:
Also included in: Statistics Bundle - Guided Notes, Worksheets & Scavenger Hunts!
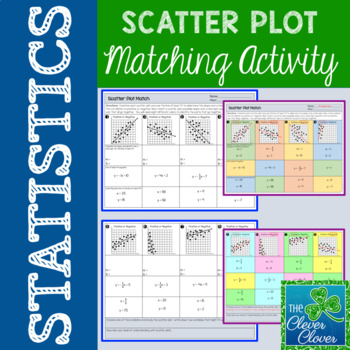
Scatter Plot Matching Activity
Scatter Plot Matching Activity
This resource allows students practice with scatter plots. Students will examine eight scatter plots. With each scatter plot, they will do the following:
✓ Identify if the scatter plot shows a positive or negative correlation
✓ Calculate the slope and determine the y-intercept
✓ Write the line of best fit equation
✓ Match a scatter plot, slope & intercept, line of best fit equation and possible coordinate pair
Students are asked to think of two variables t
Subjects:
Grades:
6th - 9th, Adult Education
Types:
CCSS:
Also included in: Scatter Plot Mini-Bundle
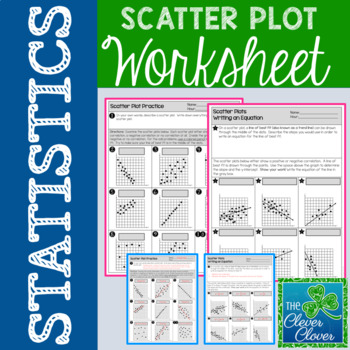
Scatter Plot Worksheet
Scatter Plot Worksheet
This resource allows students to explore scatterplots with a two page worksheet. Students are asked to define scatterplots in their own words. Nine questions ask students to identify the type of correlation (positive, negative or no correlation) that exists between two variables. Students are also asked to describe the steps used to write an equation for the line of best fit. Six additional questions require students to calculate the slope and determine the y-intercept
Subjects:
Grades:
6th - 9th, Adult Education
Types:
CCSS:
Also included in: Scatter Plot Mini-Bundle
Crash Course Statistics COMPLETE SERIES BUNDLE ~ Distance Learning
Distance Learning - #DistanceLearningEpisode Guides for Crash Course Statistics YouTube Series!Each guide comes with two versions (with and without timestamps), and a complete answer key.This product easy to use, no-prep product is a perfect last minute lesson plan, review activity, extra "filler" to keep on hand, substitute lesson plan, or homework assignment.*Great AP test prep!Plus it's only $0.70 per episode!-Answer key included for every episode guide-Questions are a variety of formats and
Subjects:
Grades:
9th - 12th, Higher Education, Adult Education
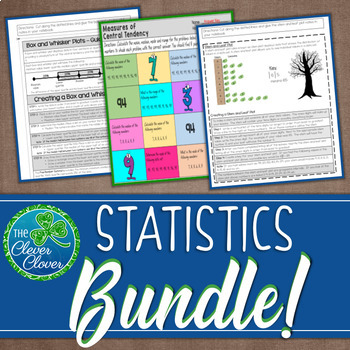
Statistics Bundle - Guided Notes, Worksheets & Scavenger Hunts!
Are your kids studying the measures of central tendency, box and whisker plots, stem and leaf plots, two-way tables, histograms and scatter plots? This valuable resource includes guided notes, worksheets, scavenger hunts, assessments and more that you can use for your statistics unit. Below you will find a brief description and link of each resource.
Measures of Central Tendency - Guided Notes, Worksheets and Scavenger Hunts
This resource includes guided notes, practice worksheets and two scave
Subjects:
Grades:
6th - 9th, Adult Education
CCSS:
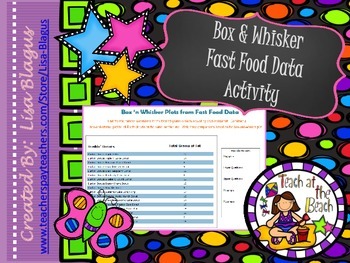
Box 'n Whisker Data for Local Fast Food Restaurants
This activity brings a real-life activity into the classroom. Students look at 4 popular fast food restaurants (Arbys, KFC, Dunkin Donuts, and Pizza Hut)and find the median, maximum, minimun, lower quartile, and upper quartile from their grams of fat. After looking at each of them, students are asked to answer questions pertaining to the box and whisker graphs they've drawn from the data. A fun way to construct graphs and look at data!!!
Looking for a few more resources? This product is par
Subjects:
Grades:
6th - 11th, Adult Education
Types:
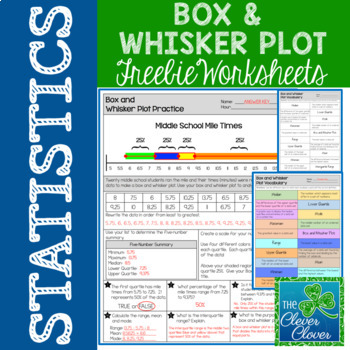
Box and Whisker Plot - FREEBIE
This resource can be used for practice with creating and interpreting box and whisker plots. Students will use twenty mile times in order to calculate the five number summary. Space is provided for students to list the numbers in order from least to greatest. Students are directed to shade and label each quartile of the box and whisker plot. After the plot has been drawn, students can answer six questions pertaining to the data.
Practice with vocabulary is also important. Students can use
Subjects:
Grades:
6th - 9th, Adult Education
Types:
Also included in: Statistics Bundle - Guided Notes, Worksheets & Scavenger Hunts!
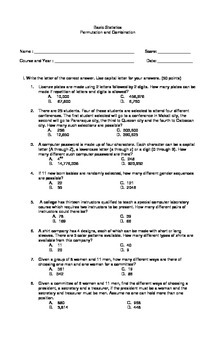
Probability and Statistics Multiple Choice on Permutation and Combination
Grab this Worksheet! a 25 multiple choice questions on probability's Permutation and Combination that will enhance and gain student's understanding on the topic!you can have this as a quiz or as a practice exercises in your class! a must have!!Viva Math!
Subjects:
Grades:
9th - 12th, Higher Education, Adult Education
Types:
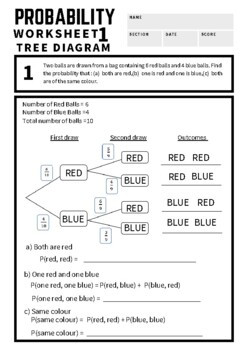
Probability Tree Diagram Guided Worksheet
Are your students having difficulty in understanding probability?Grab this Probability tree diagram guided worksheet, which will guide your students and easily let them understand in solving probability! includes 7 word problems with solution and answer key
Subjects:
Grades:
8th - 12th, Higher Education, Adult Education
Types:
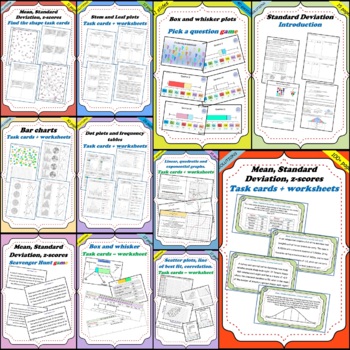
Statistics and charts + Statistics data distribution BUNDLE (450 pages)
This is a bundle package of all of my "Statistics and charts" AND MY "Statistics data distribution" products for a reduced price. This includes a total of 11 products:Statistics and charts:Bar charts, histograms and Circle graphs (1 product, 32 pages).Frequency tables and dot plots (1 product, 28 pages).Stem and leaf plots (1 product, 14 pages).Statistics data distribution:Quartiles and Box and whisker plots (2 products, , 28 pages + 41 slides).Mean, Standard Deviation, z-scores (4 products, 237
Subjects:
Grades:
10th - 12th, Adult Education
Types:
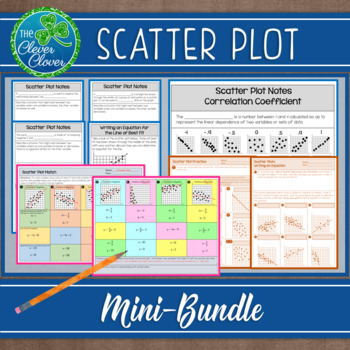
Scatter Plot Mini-Bundle
This resource includes six half pages of notes that are perfect for interactive notebooks. The first three pages introduce students to positive, negative and no correlation scatter plots. Students are asked to describe real world situations that might exist for each type of correlation. Students will graph three different sets of data in order to visualize the different types of scatterplots. Definitions for the line of best fit and correlation coefficient are provided. Each one of the half p
Subjects:
Grades:
6th - 9th, Adult Education
CCSS:
Cell Cycle/Mitosis and Chi-Squared Analysis Activity and Answer Key
Answer key and activity packet included!What's better than a cell cycle and mitosis review? A cell cycle and mitosis review that also has students complete a chi-squared analysis of data!Students will run through a lab-based scenario to help review the steps of the cell cycle and mitosis. They will also been given data based on this scenario and complete a full chi-squared analysis, including null and alternate hypotheses, using the chi-square critical values table, completing the calculations f
Subjects:
Grades:
9th - 12th, Higher Education, Adult Education
Types:

Statistics (On grade level full year curriculum)
Here is the bundle of all of my current Statistics guided notes and worksheet units. These were created for an on grade level intro to Statistics class - not for an AP class.
Subjects:
Grades:
11th - 12th, Higher Education, Adult Education
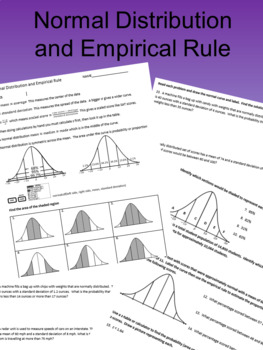
Normal Distribution and Empirical Rule Revised
This is a new and improved version of an older but popular product of mine Normal Distribution and Empirical Rule . It includes notes on the normal distribution with cleaner graphics and all new problems:It then includes 6 problems where they use the empirical rule to estimate the shaded region from a picture. Then 4 problems where they select the regions to give a desired area. A word problem where they label the curve and solve using normal distribution. The second side contains 4 problems wh
Subjects:
Grades:
9th - 12th, Higher Education, Adult Education
Types:
Data Analysis Statistics and Probability worksheets (63 Problems) (SAT Review)
Data analysis statistics and probability worksheets ,63 problemsSAT ReviewFraction and Data (29 Multiple choice questions)Statistic Problem (15 questions)Probability Word Problems This section contains 19 word problems about :Simple ProbabilityCounting PrincipleIndependent ProbabilityDependent ProbabilityMutually Exclusive EventsPermutationsCombinationsConditional Probability* AlSO AVAILABLE FOR YOU OR A COLLEAGUE! - CLICK ANY LINK YOU WANT:Number and Operations (SAT Review) Algebra & Functi
Subjects:
Grades:
7th - 12th, Higher Education, Adult Education, Staff
Types:
Crash Course Statistics Worksheets Complete Series Set Full Bundle Collection
This ZIP file contains Microsoft Word document worksheets (along with PDF versions) for each of the forty-four episodes of Crash Course Statistics hosted by Adriene Hill.Worksheets contain a combination of fill-in-the-blank and short answer questions. Each worksheet is accompanied with an answer key and relevant images.By purchasing this file, you agree not to make it publicly available (on external websites, etc.) or to share with any other teachers. It is intended for classroom use only. You *
Subjects:
Grades:
9th - 12th, Higher Education, Adult Education, Staff
Types:
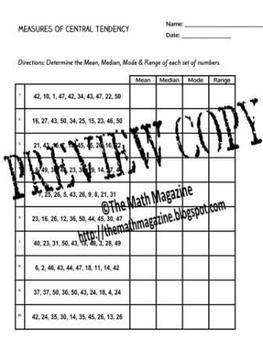
Measures of Central Tendency Worksheet with Key 6.SP.A.3, 7.SP.B.4, S-ID.2
Measures of Central Tendency Worksheet with Key 6.SP.A.3, 7.SP.B.4, S-ID.2
This is a PDF Worksheet that serves as an excellent review of the Measures of Central Tendency. The worksheet contains 10 problems in which the student will determine the Mean, Median, Mode & Range of a set of numbers.
The answer key is included.
Need a foldable for this topic? Click the link below to find one in my TpT Store.
Measures of Central Tendency Foldable
All feedback is appreciated.
Follow Me on TpT
Grades:
5th - 12th, Adult Education
Types:
Statistics Null and Alternative Hypothesis Discovery approach
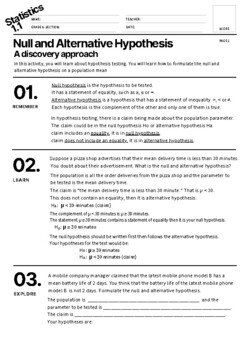
Having difficulty in teaching Null and Alternative Hypothesis?Does your student still confuse how to formulate the null and alternative hypothesis? Grab this Lecture- Activity -Quiz all in one all about how to formulate the null and alternative hypothesis.This includes, all the important points to remember. Easy to understand and student's learn it by discovering the meaning and concept by following this activity all through out.You don't need to teach long and keep on repeating for students who
Subjects:
Grades:
9th - 12th, Higher Education, Adult Education
Types:
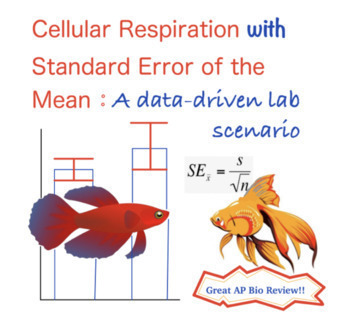
Cellular Respiration Think-it-Through Lab with Standard Error
This activity allows students to review basic concepts of cellular respiration in the context of a lab scenario. Students will work with data and complete calculations including percent change, mean, standard deviation, and standard error. In addition, students will see how error bars are drawn and learn how to interpret them on a graph. Activity A: Introduction (background, lab design, etc)Activity B: Working with data (percent change and mean calculations)Activity C: Calculating standard e
Subjects:
Grades:
9th - 12th, Higher Education, Adult Education
Types:
Also included in: Cell Resp Think-It-Through Lab with Standard Error and Answer Key
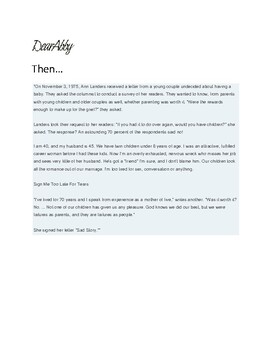
Good and Bad: Surveys, Sampling, and Bias for AP Statistics (5 assignments)
5 assignments in total. The topics involve good and bad survey questions, good and bad sampling, and bias when surveying. One assignment is a look at a Dear Abby letter. The student must identify why a survey question from the Dear Abby newspaper column would result in bias and write a letter to Dear Abby explaining why. Other assignments explore bad sampling techniques, while having students explain how to carry out proper sampling techniques (simple random, cluster, stratified, systematic)
Subjects:
Grades:
10th - 12th, Higher Education, Adult Education
Types:
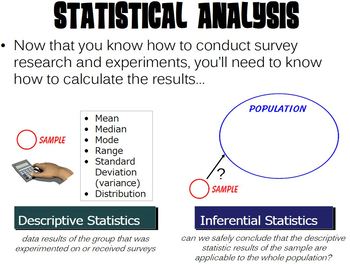
Statistical Analysis PowerPoint
Contains a PowerPoint presentation covering statistical analysis. This PP was designed to be used with a Psychology or AP Psychology course as part of a Research Methods unit, but it could also be used in a variety of math and/or statistic classes.The PowerPoint is HIGHLY animated and is designed to capture student attention. Each slide has transitions along with rich, moving media. Additionally, a guided note sheet (both an editable Microsoft Word version and a PDF version) is included in the z
Subjects:
Grades:
7th - 12th, Higher Education, Adult Education, Staff
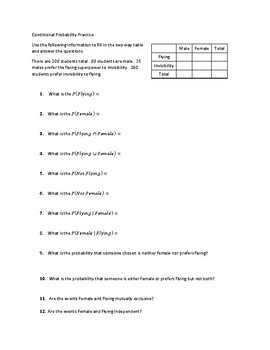
Conditional Probability Practice
This worksheet includes 18 problems with conditional probability, probability from a two way table, probability from a tree diagram, includes intersection, discusses mutually exclusive events and independent events.
Subjects:
Grades:
9th - 12th, Higher Education, Adult Education
Types:
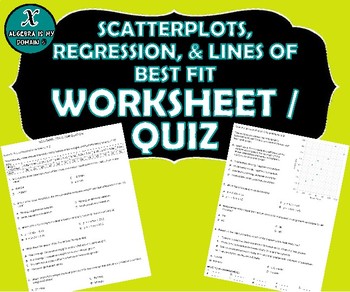
WORKSHEET / QUIZ - Scatterplots & Linear Regression
This worksheet can be used as additional practice, review, or a quiz.
It has a total of 9 multiple-choice questions. The first set of 5 questions are based on a given table. The second set of 4 questions are based on a given scatterplot.
There are questions on:
* Identifying either positive, negative, or no correlation
* Identifying and interpreting the correlation coefficient
* Identifying the line of best fit
* Interpreting the slope of a best fit line
* Causation
* Using the best fit line
Subjects:
Grades:
7th - 12th, Higher Education, Adult Education
Types:
Also included in: ALGEBRA 1 EOC REVIEWS/QUIZZES
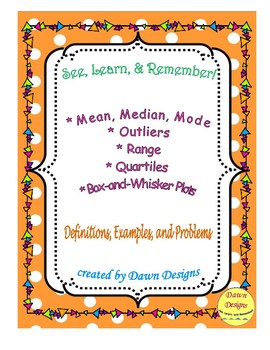
Mean, Median, Mode, Range, Outlier, Quartiles, Box and Whisker Plots
Definitions, examples, and problems to help students learn the concepts and remember them!
Concepts presented:
• Mean
• Median
• Mode
• Range
• Outlier
• Quartiles, Box-and-Whisker Plots
The worksheets include: 3 pages of definitions and examples, 3 pages of problems, and 3 pages of solutions.
******************************************************************
Feedback → TpT Credits → Discount on a future purchase!
After you purchase and review a product, you will be given a chance to prov
Subjects:
Grades:
7th - 9th, Adult Education
Types:
Showing 1-24 of 230 results


