166 results
Adult education graphing handouts
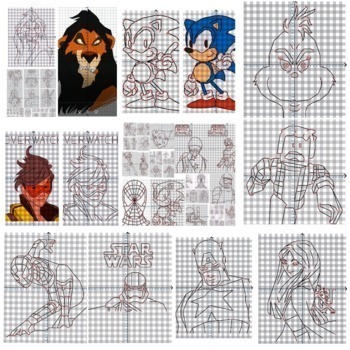
Coordinate Plane Graphing Mystery Pictures, No PREP Science Sub Plans, Math
Click on italic link below to see more images:CoordinatePicturesImages Heather C.Rated 5 out of 5Extremely satisfied"I'm in love with this resource! I love all the different characters especially Scar! My students were engaged and can now plot points correctly."Favorite math activity for students! Teachers have commented how students love this activity! Even teachers love doing them! :) This activity will SAVE YOU over 150 plus hours of class work! Education related and even use it for sub plans
Grades:
6th - 12th, Higher Education, Adult Education
Types:
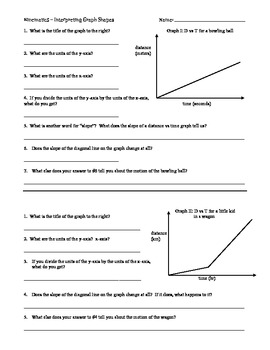
Graphing - Interpreting Distance vs Time Graphs
This worksheet gives students 4 distance vs time graphs and a series of questions about each to lead them through reading graphs. The main goal is to hammer home the point that slope = velocity.This is the second in my set of worksheets on graphing that will lead students through the basics of constructing graphs, interpreting the meaning of graphs, and calculating quantities from graphs.This is ideal for physical science classes where the students are in pre-algebra or algebra 1.
Subjects:
Grades:
7th - 9th, Adult Education
Types:
Also included in: Graphing Bundle
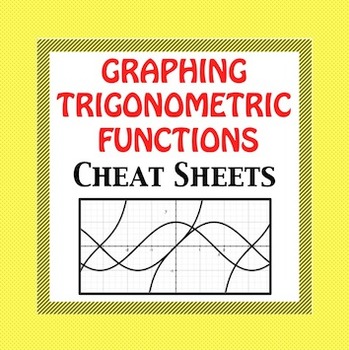
Trig Functions - Graphing Cheat Sheet
Trig Functions - Graphing Cheat Sheet*****UPDATED with different formula versions******Text books make graphing trig functions so complicated. I have simplified the process so that even below average students can follow the process easily and graph trig functions without frustration. I have passed these trig notes out to absent students and NO explanation was necessary! Trig graph paper also is included.The different versions use different formulas and variables.y = asin(bx−c)+d y = asi
Subjects:
Grades:
10th - 12th, Higher Education, Adult Education
Types:
Writing Linear Equations - Find Slope from Tables, Graphs and Word Problems
Slope Cards, Handouts or ReviewThis worksheet helps students find slope problems from tables, graphs or word problems and allows the students to see all parts of writing linear equations.Includes:-Word Problems (slope)-Graphing Linear Equations-Table (slope)Can be used for: classroom assignments, homework, center material, prep material and review.Students or Teachers can also develop their own with blank cards, handouts.You can also purchase the following that are part of slope and y-intecept
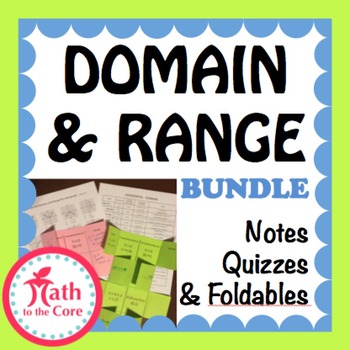
Domain and Range of a Graph Bundle
Domain and Range of a Graph Notes, Homework, and Quiz Bundle
with inequality, interval, and set builder notation
This will stop all confusion of Domain and Range Notation!!!
My students find the chart invaluable especially the Vertical Graph depictions.
Included in this package
1. Complete Chart for Domain and Range Notation
2. Complete Chart for Domain Notation
3. Complete Chart for Range Notation
4. Foldable Template
5. Quiz 1 (easy) version A
6. Quiz 1 Key
7. Quiz 2 (easy) version
Grades:
7th - 12th, Higher Education, Adult Education
Types:

Linear Functions
Linear Functions
This is a great one page cheat sheet on the following three forms of a line...
Intercept Form, Point Slope Form, and Standard Form
Also included, is how to find intercepts and slopes.
Two sheets are included, one in color and the other in black and white.
Easily made into a tri-foldable.
Connect with Me
Follow my WebsiteMath to the Core on FacebookMath to the Core BlogMath to the Core on PinterestMath to the Core on TwitterMath to the Core on Instagram
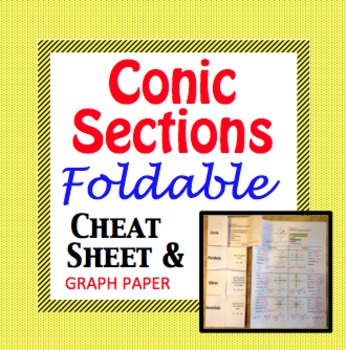
Conic Sections Cheat Sheet - Foldable for Circle, Parabola, Ellipse, Hyperbola
Conic Sections Cheat Sheet - Foldable for Circle, Parabola, Ellipse, and Hyperbola. Graph paper included!
*** UPDATED *** Now with highlighted a,b, and c lengths AND a version with parametric equations.
Create a foldable or just pass out the Conic cheat sheet, the choice is yours.
Please view my free preview.
I also use the unfilled conic foldable as a quiz or pretest warmup.
This is a comprehensive guide to the 4 conic sections (circle, parabola, ellipse, and hyperbola).
This file inc
Subjects:
Grades:
9th - 12th, Higher Education, Adult Education
Types:

Quadratic Equation
Quadratic Equation
Quadratic Function Cheat Sheet - Foldable for the Equation of a Parabola
UPDATED - Now with a fill in the blank version. Perfect for note taking or a quiz.
This is a great one page cheat sheet on the following three forms of a parabola...
Intercept Form, Vertex Form, and Standard Forms.
Details regarding maximum, minimum and intercepts included.
Easily made into a tri-foldable.
Products you may also like...
Quadratic/Parabola Function Graph Trasformation - Card Ma
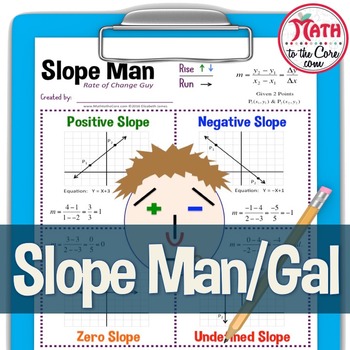
Slope Man and Gal Creative Slope Activity
Understanding slope can be confusing. Using this activity, students create a great visual to help remember the 4 different types of slopes.
Students create a unique face to demonstrate the 4 types for slopes.
Positive, negative, zero and undefined slope are included.
Equations of the lines are also included to help differentiate between the slope of a line and the equation of a line.
20 versions of the worksheet are included for personal customization.
Products you may also like..
Grades:
7th - 12th, Higher Education, Adult Education
Types:
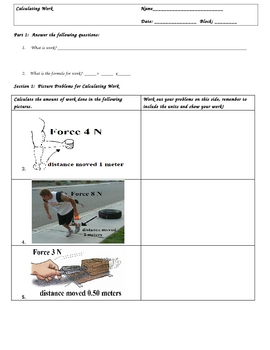
Calculating Work (W=Fxd) Worksheets and Key
Calculating Work (W=Fxd) Worksheets and KeyIf you have been teaching a Simple Machines or Energy Unit, then you need to check out this three page lesson to teach calculating work. It is in three sections.Section 1: Picture QuestionsSection 2: Word Problems/with Challenge QuestionsSection 3: Charting/Graphing ProblemsAll problems are worked out and the key is included.These worksheets include the renown Triangle Method, which has been a proven problem solver for students who struggle in math.The
Subjects:
Grades:
3rd - 12th, Higher Education, Adult Education
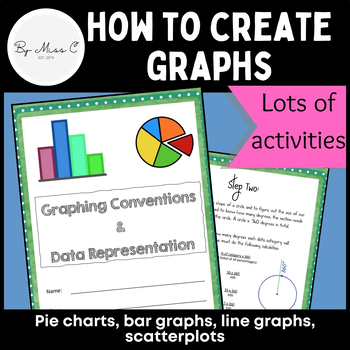
Guide to graphs: Pie charts, bar graphs, line graphs, scatterplots + activities
This is a fantastic resource for introducing students to graphing and data representation. This booklet will take students through the uses for particular graphs and how to construct them. At the end of each module, there are activities for students to complete, to practice their graphing skills. Answer key is included, making this a no-prep activity. This booklet covers: - why we visually represent data- pie charts and how to create them - bar graphs and how to create them - line graphs and how
Subjects:
Grades:
6th - 12th, Higher Education, Adult Education
Types:
CCSS:
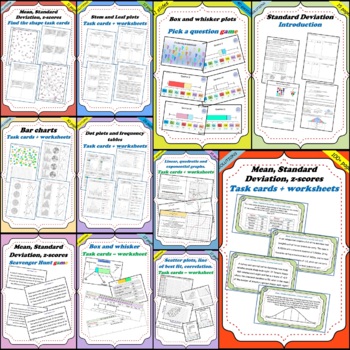
Statistics and charts + Statistics data distribution BUNDLE (450 pages)
This is a bundle package of all of my "Statistics and charts" AND MY "Statistics data distribution" products for a reduced price. This includes a total of 11 products:Statistics and charts:Bar charts, histograms and Circle graphs (1 product, 32 pages).Frequency tables and dot plots (1 product, 28 pages).Stem and leaf plots (1 product, 14 pages).Statistics data distribution:Quartiles and Box and whisker plots (2 products, , 28 pages + 41 slides).Mean, Standard Deviation, z-scores (4 products, 237
Subjects:
Grades:
10th - 12th, Adult Education
Types:
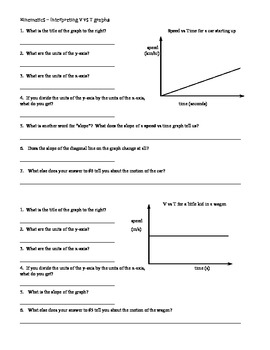
Graphing - Interpreting Velocity vs Time Graphs
I use this worksheet on velocity vs time graphs as a followup to the distance vs time graphs before introducing the kinematic equations. This is primarily for an introductory physical science class or lower level physics class. The goal is to guide students through looking at details of graphs and think about what the graphs mean physically. Key is included as pages 3 and 4.
Subjects:
Grades:
8th - 10th, Adult Education
Types:
Also included in: Graphing Bundle
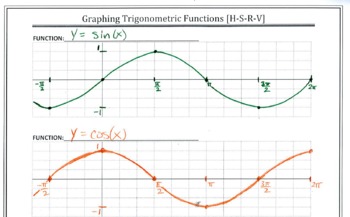
Graph Paper for Trig Functions
This changes everything! Student work becomes more consistent. Your grading will be so much easier! Using the four aligned graphs makes translations of trig functions crystal clear. This file has 2 pages of coordinate planes for graphing trig functions.The first page contains four blank graphs per page. The axes are unlabeled so that students may select their own scale.The second page has five blank graphs per page and is set up for conducting transformations on the coordinate plane.Please see
Subjects:
Grades:
10th - 12th, Higher Education, Adult Education
Interpreting Graphs and Charts
Students work with a variety of 25 graphs and charts and learn how to interpret the information provided. The format varies from one to the other: pie, column bar, horizontal bar, line/dot, and picture (volcano) graphs and table charts. Appropriate for math, Social Studies, ELA, ESL, and Spanish culture. Can be used in Gr. 6-12, adult education, college, and home school. All answer keys provided.
Grades:
6th - 11th, Higher Education, Adult Education
Types:
End Behavior of Polynomials Cheat Sheet or Foldable
End Behavior of Polynomials Cheat Sheet or Foldable.
Create a foldable or just pass out the End Behavior cheat sheet, the choice is yours.
I have found that this is the BEST way to teach end behavior.
Your students will understand this concept in 5 minutes guaranteed!!! If they do not, then please let me know!
5 pages included.
Front of End Behavior Foldable
Inside of End Behavior Foldable
One page Cheat Sheet Fillable
One page Cheat Sheet Filled
One page Cheat Sheet Filled (slight variati
Subjects:
Grades:
9th - 12th, Higher Education, Adult Education
Types:
Slope Graphic Organizer and Guided Notes
This is a great graphic organizer to help students recall four different ways to find the slope of a linear function. These four ways include: From a graph, an equation, a table, and two given points.
The second graphic organizer helps students have a reference guide for positive, negative, zero, and undefined slope.
This graphic organizer has guided notes, multiple examples, and little tricks to help students remember positive, negative, zero, and undefined slope.
The Link-Slope Task Car
Grades:
6th - 12th, Higher Education, Adult Education
Graphing Linear Equations - Practice: Plot Points, X- and Y-Intercepts, Slope
This worksheet packet was designed to be used after lecture for extra practice. Charts and rectangular (Cartesian) coordinate grids are provided to aid in plotting the ordered pairs on the graph. Three methods for graphing lines are included:• Point Plotting• X- and Y-Intercepts• Slope-InterceptSolutions are provided, which are duplicates of the practice problem pages with the answers filled in and the graphing completed.You may also be interested in these graphing worksheet products:Graphing Li
Subjects:
Grades:
7th - 11th, Higher Education, Adult Education
Types:

Linear Equation Solutions Cheat Sheet - Foldable
Linear Equation Solutions Cheat Sheet - Foldable
Intersecting, parallel, and identical lines are featured with clear examples.
One Solution, No solution, and Infinitely Many Solutions are shown via graph, linear equations, and worked out solutions to their system of equations.
Discussion of slope and y-intercept are included for all three solution types.
This is a great one page cheat sheet which can easily made into a tri-foldable.
All of my students find it to be a great tool. I a
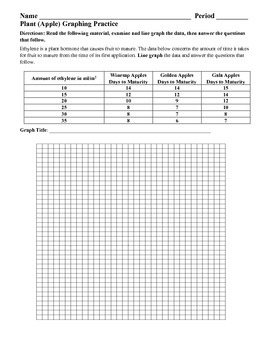
Graphing Practice for Science with Critical Thinking Questions
This is a double sided worksheet for students to practice graphing using data from a plant. Critical thinking questions also follow the creation of the graph for practice with data analysis and higher order thinking skills.
Grades:
9th - 12th, Adult Education
Types:
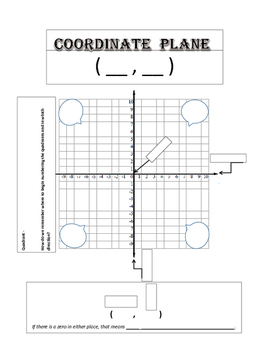
Coordinate Plane Graphic Organizer
This is a graphic organizer that I made for my students' interactive notebook. The students label each part of the coordinate plane and have visual clues to help them. This is a great review before moving on to graphing points, graphing lines, transformations on the coordinate plane, etc.
Grades:
5th - 12th, Higher Education, Adult Education, Staff
Mean, Median, Mode, Range, Outlier, Quartiles, Box and Whisker Plots
Definitions, examples, and problems to help students learn the concepts and remember them!
Concepts presented:
• Mean
• Median
• Mode
• Range
• Outlier
• Quartiles, Box-and-Whisker Plots
The worksheets include: 3 pages of definitions and examples, 3 pages of problems, and 3 pages of solutions.
******************************************************************
Feedback → TpT Credits → Discount on a future purchase!
After you purchase and review a product, you will be given a chance to prov
Subjects:
Grades:
7th - 9th, Adult Education
Types:
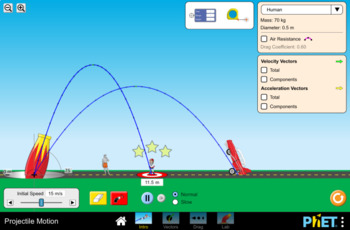
Projectile Motion Simulation Lab- PhET
This handout is meant to accompany the Projectile Motion simulation found here: https://phet.colorado.edu/en/simulation/projectile-motion
45 minute lesson time
This lab can be used to teach a range of concepts such as:
-Relationships between independent/manipulated and dependent/responding variables
-Forces in motion
-Projectile Motion
-The relationship between firing angle and distance traveled
-Graphing independent/ dependent variables
-Creating data tables
Subjects:
Grades:
6th - 12th, Higher Education, Adult Education
Types:
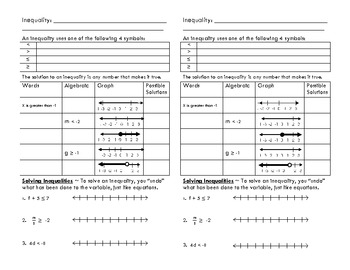
Inequalities - Scaffolded Notes for Math
This is a half-page that my students fill out during a mini-lesson and glue into their math journals. It has an overview of the 4 symbols and what they mean, a table to practice using the various symbols, and then three problems at the end for students to practice solving and graphing one-step inequalities.
Grades:
5th - 8th, Adult Education
Types:
Showing 1-24 of 166 results


