54 results
5th grade statistics projects for Microsoft Word
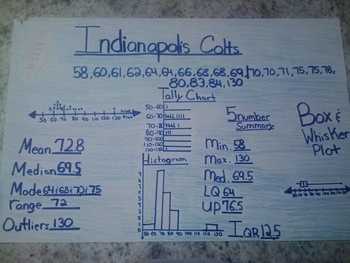
Favorite Sports Team: Data Displays and Measures of Central Tendency Project
Students will create a poster using sports statistics. Depending on the time of year, you may want to use football scores, basketball scores, data from the Olympics, etc. Students will use the internet (or you can print out statistics for them) to find sports data.
The students really buy into this project because it is about something they are interested in - their favorite sports team!
Students will display their knowledge of several data displays: line plot, tally chart, histogram and bo
Subjects:
Grades:
5th - 8th
Types:
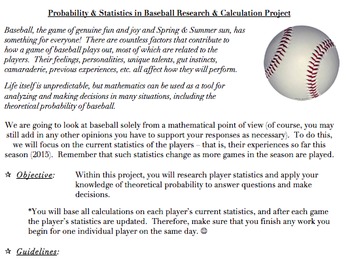
Probability & Statistics in Baseball Project (Common Core Aligned, AND FUN!)
The problems and activities within this document are designed to assist students in achieving the following standards: 6.SP.B.5, 7.SP.C, HSS.CP.A.2, HSS.CP.A.3, HSS.CP.B.7, HSS.CP.B.9, as well as the standards for mathematics practice and the literacy standards. They are also designed to help the teacher assess the students’ abilities when it comes to working with the ideas within the standards.This document contains the following:A project designed to allow students to investigate theoretical
Subjects:
Grades:
5th - 12th, Higher Education, Adult Education, Staff
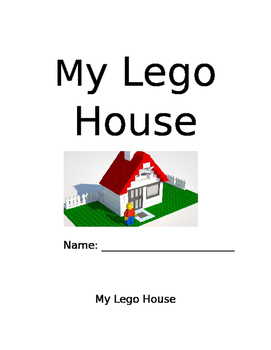
My Lego House
This is a 2-3 week maths project for anyone from Grade 3-6. Done in pairs or small groups the project entails students designing and building their own Lego house. In the project students will cover a range of maths concepts including area, perimeter, counting, money, graphing and interpreting data. The project includes a detailed teacher booklet with photographs of student's work and examples for each of the lessons. The student book is also included for students to work from, although we found
Subjects:
Grades:
3rd - 6th
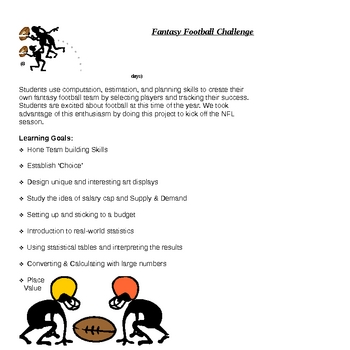
Are You Ready for Some FOOTBALL? (Middle School MATH Project)
Are you looking for a unique way to engage your students in authentic math concepts using real-world data that will blow their socks off? If so, this is your project! I have used this with eighth graders, but it would work well with any middle school performance indicators. This project involves so many performance indicators - estimation, rational numbers, scientific notation, number & word forms, budgeting, graphs, statistics, integers, media, cooperative learning, research, technology, vi
Subjects:
Grades:
5th - 8th
Survey Project - Frequency table, Mean, Median, Mode, and Various Plots
This project is a 2 part project about different ways to display data.
In part 1, Students will create a question with 4-6 possible answer choices. After surveying 50 different people, students will create a frequency table displaying their data. There are questions for students to answer about the survey and the people they’ve surveyed.
In part 2, students will create a question that will trigger an answer that is a number. After surveying 25 different people, students will find the mean,
Subjects:
Grades:
5th - 7th
Types:
CCSS:
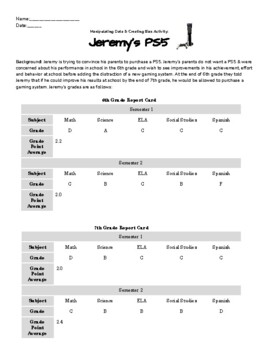
Manipulating Data & Creating Bias Activity
Manipulating Data & Creating Bias Activity: Teach your students about how charts and statistics can be skewed; and real numbers can reflect bias with this fun project! Students are given a role (either Jeremy or his parents) and have to use two pieces of data from Jeremy's 6th & 7th grade report card to argue for or against his deserving of a PS5!Students get to be creative & make cross-curricular connections to ELA as they use logical fallacies & skewed graphs to make their argu
Subjects:
Grades:
4th - 11th
Types:
CCSS:
NGSS:
HS-ETS1-4
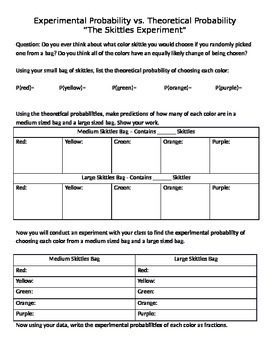
Skittles Probability Experiment
This experiment allows students to explore the differences between experimental and theoretical probability.
Materials:
One large bag of Skittles
One normal bag of Skittles
One Fun Size bag of Skittles for each student
Subjects:
Grades:
5th - 12th
Types:
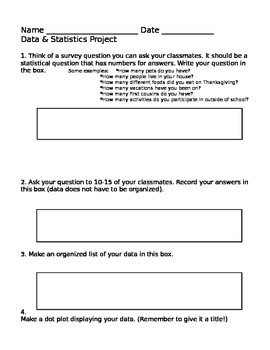
Statistics & Data Survey Project 6.SP
This is a review project to be used at the end of the statistics unit for 6th grade Common Core math (CC.6.SP). Students create their own statistical question and survey classmates. They then use the survey data to create a dot plot, frequency table, histogram, and box & whisker plot. Students must also find the mean, median, mode, range, and mean absolute deviation of the data set. This project connects the statistics unit with real-world questions and brings the concepts to life.
In .doc
Subjects:
Grades:
5th - 7th
Types:
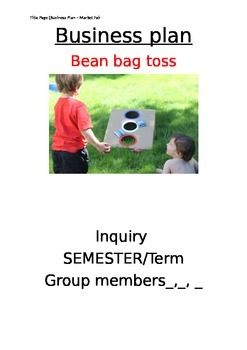
Market Fair Activity Plan - Inquiry Process
Planning a fair or market at your school?
Do you want your students to be involved and run stalls?
Here is a business plan for more senior students to use that includes the process and reflection pages.
It also includes a journal page that must be kept and a plan for the students to follow each week.
There is also examples of advertisements they can use to bring people to their stall or activity.
There is also a plan for the teacher to use. This includes the learning goals and other key pieces o
Subjects:
Grades:
5th - 10th
Common Core Rich Math Task in Data Management NO PREP
Looking for a rich math task that aligns with the common core standards? This math project is used for the data management outcome. Use this project to teach the entire unit. This project has exemplars to use as guides for students. Have students brainstorm their own survey and census questions!
--------------------------------------------------------------------
What's included?
- Step by step instructions on how to conduct a survey or census
-A copy of a 5 page census survey, created by my o
Subjects:
Grades:
5th - 12th
Types:
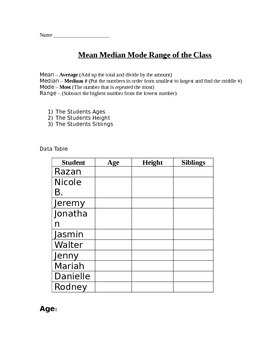
Mean Median Mode & Range Project
This project is a cooperative group project where students will collect data from up to 10 friends in the classroom such as height, age and number of siblings. They will than answer numerous questions about the data including but not limited to Mean, Median, Mode and Range of each category. This is a word document that can be edited to fit your classroom population more adequately
Subjects:
Grades:
5th - 8th
Types:
CCSS:
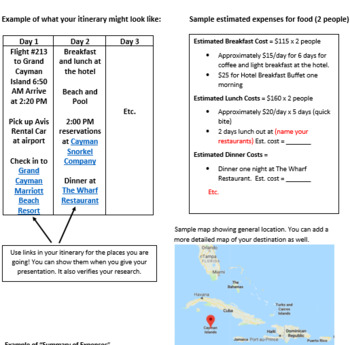
Dream Vacation Project
This is a great end-of-year project. I like to assign it just after state testing to give my students a little break and allow them to use some creativity. This is a completely editable word document so you can make modifications to suit the needs of your students. You can easily add additional criteria or remove some for younger students.The download includes a page with sample itineraries, expense sheets, etc.
Grades:
5th - 8th
Types:

Data Collection Project
This project has student generate a question to survey, survey a large group of people, collect the data, create graphs, and analyze that data. Student can create their graph by hand or using Excel. This is a great way to end a unit on graphs.
Subjects:
Grades:
4th - 5th
Project Based Learning: Statistics Project {EDITABLE}
This project allows student to pick a statistical question that interests them to collect data on. They will gather data from up to 15 people and then use their own data to solve, create and describe the following:- mean- median- mode- range- interquartile range- outliers - histogram- dot plot- stem and leaf plot- box and whisker plot- shape distribution- summary paragraph of their findingsWe have used this at the end of our unit, and the kids found it fun to be able to collect data on something
Subjects:
Grades:
5th - 8th

Surface Area Candy Wrapper Project
Other required materials: Ruler with mm, ANY 3 types of candy (THIS PROJECT IS MADE WITH CARAMELS, STARBURSTS, NOW & LATERS)** COMPLETELY EDITABLE **-Be sure to edit the document for the 3 types of candy you choose!-Made for 6th grade ccss, but could be easily edited to meet your needs!This project is to teach students about surface area and why it is important in the real world. The goal for students is to figure out which candy wastes the most in packaging by measuring surface area of a ca
Subjects:
Grades:
5th - 8th
Types:
Data and Statistics Project!
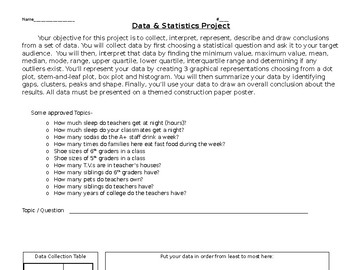
This is such a fun way to bring statistics to LIFE! The objective for this project is to collect, interpret, represent, describe and draw conclusions from a set of data. Students will collect data by first choosing a statistical question and ask it to their target audience. I had my kids spend a whole class period going around campus asking their questions for data collection! Then, students will interpret that data by finding the minimum value, maximum value, mean, median, mode, ra
Subjects:
Grades:
5th - 8th
Types:
Venn Diagram Project
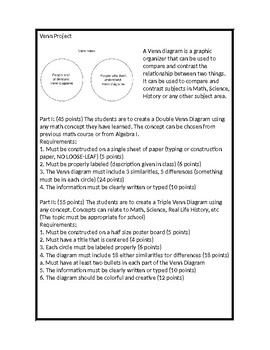
A Venn diagram is a graphic organizer that can be used to compare and contrast the relationship between two things. It can be used to compare and contrast subjects in Math, Science, History or any other subject area.
Subjects:
Grades:
3rd - 12th

Math Probability & Statistics: M&M's Worksheet, Activity, group work
Materials Needed:A bag of plain M&M's for each student (or group of students)Handout for each studentDiscussion before the bags are opened:1. How many M&M's are in each bag?2. How many of each color?3. Will all 6 colors be in each bag?4. Which color will occur the most? the least?Extension:Have students to research the Mars company official percentages for each color.In this activity, students find the probability of choosing a particular color M&M given the number of M&M's in th
Subjects:
Grades:
4th - 10th
Types:
Graphing and Surveying Project
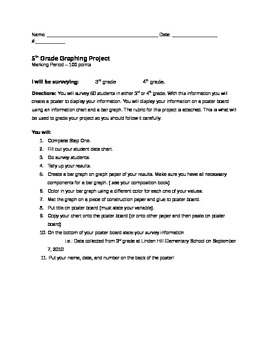
A graphing and Surveying Project for students to get a better idea of how to create different types of graphs. I have used this with fourth and fifth grades and it was fantastic!
The attachment includes: Step by Step directions for the project, a brainstorming sheet, a chart to take the survey on, a written response sheet, and a rubric to grade students.
Graphing and Surveying Project is licensed under a Creative Commons Attribution 3.0 United States License.
Subjects:
Grades:
3rd - 6th
Types:
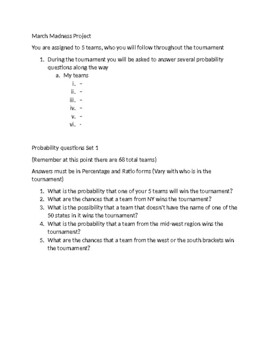
Math March Madness Project
Sports and Math are the perfect combination! This project is a fun way for students to use ratios and probabilities in the real-world excitement of the March Madness Tournament. I have included sample questions, however, the instructor will have to change them based on who is in the tournament in any given year. I also usually print out the March Madness brackets and let the students attempt those as well. I keep a class one that I fill out as the tournament happens.
Subjects:
Grades:
5th - 7th
Types:
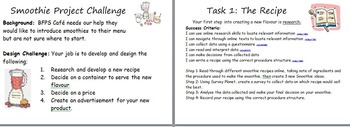
Smoothie Project integrated, capacity, money, data, recount, persuasive
Integrated cross-curriculum project.
Included;
* Project instructions
* Success Criteria linked to Australian Curriculum
* Teacher Notes
Project is linked to;
Maths - Data, Measurement: Capacity, Money,
English - Online navigation and research, Procedure and Persuasive texts.
Project Outline:
Students will undertake research into developing a new smoothie, throughout this project students must work as a team to create a new recipe, decide on a container, cost and advertising platform.
Subjects:
Grades:
3rd - 6th
Types:
Creating A Line Graph Performance Task
In this activity, students will gather data and create a line graph using Excel and Microsoft Word. Included you will receive detailed instructions for the task, steps to creating a line graph in Excel, an example, and a grade sheet/rubric for the final product.
Grades:
5th - 8th
Types:
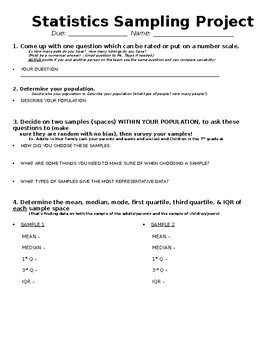
Statistics Sampling Project
An editable project where students will conduct a survey to conclude an outcome. Students will need to provide and explain their sample spaces, means, medians, modes, interquartile ranges, and IQRs, as well as construct dot plots and box plots on the data. The project comes with a rubric (broken down in points out of 100) on the project itself! I had students show work on a poster board, however, most of this work could be done on paper if you wished!
Subjects:
Grades:
5th - 10th
Types:
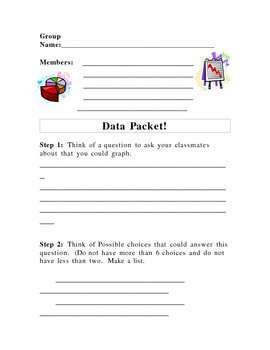
Circle Graph Project
This is a project for pairs or teams of students. They choose a question to graph by coming up with up to 6 possible responses. Then they ask their classmates and turn their answers into a circle graph.
Subjects:
Grades:
2nd - 6th
Types:
Showing 1-24 of 54 results


