115 results
Free high school statistics lectures
Introduction to Probability Distributions (Lesson with Homework)
Elementary Statistics - Introduction to Probability DistributionsCommon Core Aligned Lesson with HomeworkThis lesson plan includes:-Lecture Notes (PDF, PowerPoint, and SMART Notebook)-Blank Lecture Notes (PDF and SMART Notebook)-Homework (PDF and Word)-Answer Key (PDF)You do not need to have PowerPoint or SMART Notebook to receive the full benefits of this product. There are also PDF versions included!Lesson Objectives:-Determine if a variable is discrete or continuous.-Construct a probability d
Subjects:
Grades:
10th - 12th, Higher Education
CCSS:
Also included in: Distributions of Data Lesson Plan Bundle
Lecture Slides (Chapter 7) Data, Probabilities, and Predictions
Lecture notes on understanding data, distributions, descriptive statistics, probabilities, predictions, laws of probabilities, the law of large numbers, expectations, payoffs, risk aversion, conditional probability, statistical inference, and some applications in sustainability and environmental modeling.
Subjects:
Grades:
10th - 12th, Higher Education

Real Numbers
Much of this material should be familiar to you, but some of it may be new. Although it is only a language or set of rules to help you deal with statistics, without it you will not be able to make sense of the following chapters. Before you continue, make sure you have completed all the learning activities and understood what you have done.
Subjects:
Grades:
7th - 9th

Probability and Stats Unit A Powerpoint
High School Probability and Statistics (basic level) - Unit A One Variable Statistics (5 units in the course)
Subjects:
Grades:
9th - 12th
Types:
AP Statistics 03.1.1: Bivariate (two-variables) Scatterplots
Objectives:
-Given a two-variable data set, construct and interpret a scatterplot.
-Identify variables as explanatory or response variables.
-Describe an association in terms of:
*Direction
*Shape (or form)
*Strength
Reference Text:
The Practice of Statistics, First Edition.
Yates, Moore, McCabe
http://www.whfreeman.com/Catalog/static/whf/yates/
Subjects:
Grades:
10th - 12th, Higher Education
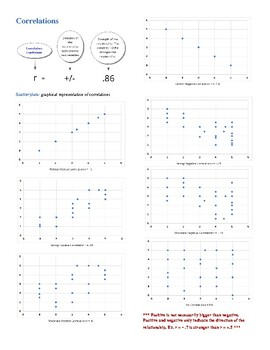
Correlations Visual
Help your students understand correlation coefficients and how to read scatterplots with this simple visual.
Subjects:
Grades:
10th - 12th
Types:
AP Statistics 01.1.1: Describing Distributions Visually
Objectives:
-State whether a variable is categorical or quantitative.
-Manually create a dotplot and a histogram that represent given data.
-Describe a distribution in terms of center, spread and shape.
Reference Text:
The Practice of Statistics, First Edition.
Yates, Moore, McCabe
http://www.whfreeman.com/Catalog/static/whf/yates/
Subjects:
Grades:
10th - 12th, Higher Education
AP Statistics 06.2.1: Probability Basics
Probability Basics
Objectives:
-Write the sample space for a set of events.
Count the outcomes in a sample space by using:
**A branching (tree) diagram.
**The multiplication principle.
-Apply the basic rules of probability to solve problems.
-Describe what is meant by the complement of an event.
-Describe what it means to say that two events are disjoint.
**Use the addition rule for disjoint events to answer “or” probability questions.
Reference Text:
The Practice of Statistics, First Edition.
Subjects:
Grades:
10th - 12th, Higher Education
AP Statistics 02.2.1: The Standard Normal Distribution
Objectives:
-State mean and standard deviation for The Standard Normal Distribution
-Given a raw score from a normal distribution, find the standardized “z-score”
-Use the Table of Standard Normal Probabilities to find the area under a given section of the Standard Normal curve.
Reference Text:
The Practice of Statistics, First Edition.
Yates, Moore, McCabe
http://www.whfreeman.com/Catalog/static/whf/yates/
Subjects:
Grades:
10th - 12th, Higher Education
AP Statistics 05.2.1: Designing Experiments
Designing Experiments
Objectives:
-Describe the difference between an observational study and an experiment.
-Draw a schematic diagram of a completely randomized experiment that allows comparison between a treatment group and a control group.
-State the three principles of experimental design.
-Describe what is meant by “statistically significant”.
-Describe what is meant by a “double blind” experiment.
Reference Text:
The Practice of Statistics, First Edition.
Yates, Moore, McCabe
http://www.
Subjects:
Grades:
10th - 12th, Higher Education
AP Statistics 06.3.1: Conditional Probability
Conditional Probability
Objectives:
-Recognize whether a conditional probability problem calls for the use of the “or” case rules or the “and” case rules.
-Apply the “or” case rules for disjoint and dependent cases.
-Apply the “and” case rules for independent and dependent cases.
Reference Text:
The Practice of Statistics, First Edition.
Yates, Moore, McCabe
http://www.whfreeman.com/Catalog/static/whf/yates/
Subjects:
Grades:
10th - 12th, Higher Education
AP Statistics 05.1.1: Simple Random Samples
Simple Random Samples
Objectives:
-Describe the difference between a population and a sample.
-Describe the difference between a census and a survey.
-Describe what is meant by bias in a sample.
-Describe what is meant by a:
*Voluntary Response Sample.
*Convenience Sample.
*Simple Random Sample.
-Use a Table of Random Digits to construct a Simple Random Sample of specified size from a population.
Reference Text:
The Practice of Statistics, First Edition.
Yates, Moore, McCabe
http://www.whfreem
Subjects:
Grades:
10th - 12th, Higher Education
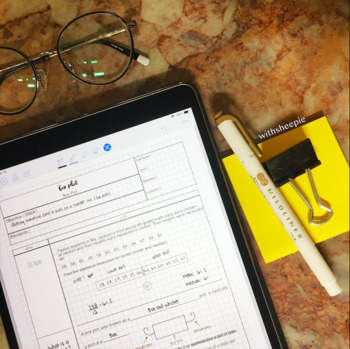
AP Statistics 01.2.1: Measures of Center and Spread
Objectives:
-Define specific measures of center and spread in a distribution
-Recognize notation for mean, median, and the 5-number summary of data
-Calculate same manually and on TI
-Determine outliers by the 1.5 IQR rule
-Draw boxplots manually and on TI
-Describe RESISTANCE as it applies to mean and median
Reference Text:
The Practice of Statistics, First Edition.
Yates, Moore, McCabe
http://www.whfreeman.com/Catalog/static/whf/yates/
Subjects:
Grades:
10th - 12th, Higher Education
AP Statistics 09.3.2: The Central Limit Theorem
The Central Limit Theorem
Objectives:
-Perform an activity that demonstrates the effect of the Central Limit Theorem.
-Write a statement of The Central Limit Theorem.
Reference Text:
The Practice of Statistics, First Edition.
Yates, Moore, McCabe
http://www.whfreeman.com/Catalog/static/whf/yates/
Subjects:
Grades:
10th - 12th, Higher Education
AP Statistics 06.2.2: Independent Events
Independent Events
Objectives:
-Describe what it means to say that two events are independent.
-Use the multiplication rule for independent events to answer “and” probability questions.
-Answer “at least” probability questions through the use of complementary probability.
Reference Text:
The Practice of Statistics, First Edition.
Yates, Moore, McCabe
http://www.whfreeman.com/Catalog/static/whf/yates/
Subjects:
Grades:
10th - 12th, Higher Education
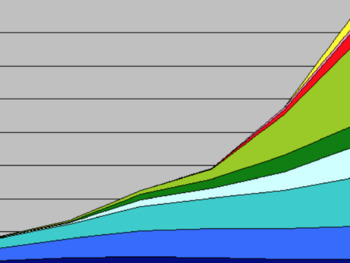
Introduction to Social Science Statistics - Chapter 1
This is the first Powerpoint presentation in a series that will teach you the statistical methods for the social sciences. After you view this first lesson, you will be able to answer the following questions: 1. How can statistical methods help you in your work? 2. What is the difference between a sample and a population? 3. What are descriptive statistics? and 4. What are inferential statistics? The next Powerpoint in this series will focus on variables and measurement scales. Dr. Laura Roberts
Subjects:
Grades:
11th - 12th, Higher Education
4:10
Mathematics - Statistics for Beginners - Introduction Algebra
Topics covered in this session:
1. What is Statistics?
The branch of mathematics that deals with the collection, organization, analysis, and interpretation of numerical data. Statistics is especially useful in drawing general conclusions about a set of data from a sample of the data.
2. Things we do with a data in statistics:
- Data Collection
- Organization
- Analysis
- Interpretation
- Presentation
This particular video deals with all the basic of how to collect the data, wh
Subjects:
Grades:
6th - 10th
Types:
AP Statistics 03.3.3: Residuals and Residual Plots
Objectives:
-Calculate the value of a residual at a point on a LSRL.
-Create a residual plot on the calculator and draw a conclusion about the goodness of fit of the LSRL.
Reference Text:
The Practice of Statistics, First Edition.
Yates, Moore, McCabe
http://www.whfreeman.com/Catalog/static/whf/yates/
Subjects:
Grades:
10th - 12th, Higher Education
AP Statistics 04.1.2: Exponential Regression Practice
Included Activities:
-Review Problem 4.1 on calculator.
-Do the Oil Production problem in class.
Reference Text:
The Practice of Statistics, First Edition.
Yates, Moore, McCabe
http://www.whfreeman.com/Catalog/static/whf/yates/
Subjects:
Grades:
10th - 12th, Higher Education
AP Statistics 04.3.1: Associations in Categorical Data
Associations in Categorical Data
Objectives:
-Given a two-way table of counts for two categorical variables:
*Find the marginal distributions of the variables.
*Find a conditional distribution of the variables.
*Display the distributions as bar charts.
Reference Text:
The Practice of Statistics, First Edition.
Yates, Moore, McCabe
http://www.whfreeman.com/Catalog/static/whf/yates/
Subjects:
Grades:
10th - 12th, Higher Education
AP Statistics 04.9: Unit 2 Review
Objectives:
-Review Section 3.1: Scatterplots.
-Review Section 3.2: Correlation.
-Review Section 3.3: Least Squares Regression.
-Review Section 4.1: Modeling Nonlinear Data.
-Review Section 4.2: Interpreting Correlation and Regression.
-Review Section 4.3: Relations in Categorical Data.
Reference Text:
The Practice of Statistics, First Edition.
Yates, Moore, McCabe
http://www.whfreeman.com/Catalog/static/whf/yates/
Subjects:
Grades:
10th - 12th, Higher Education
AP Statistics 01.2.2: Standard Deviation
Objectives:
-Describe verbally the meaning of STANDARD DEVIATION.
-Calculate the VARIANCE and STANDARD DEVIATION of a data set from a formula and on the TI.
Reference Text:
The Practice of Statistics, First Edition.
Yates, Moore, McCabe
http://www.whfreeman.com/Catalog/static/whf/yates/
Subjects:
Grades:
10th - 12th, Higher Education
AP Statistics 05.2.2: Three Principles of Experimental Design
Three Principles of Experimental Design
Objectives:
-State the three principles of experimental design.
-Describe what is meant by “statistically significant”.
-Describe what is meant by a “double blind” experiment.
Reference Text:
The Practice of Statistics, First Edition.
Yates, Moore, McCabe
http://www.whfreeman.com/Catalog/static/whf/yates/
Subjects:
Grades:
10th - 12th, Higher Education
Showing 1-24 of 115 results


