34 results
Free high school statistics scaffolded notes
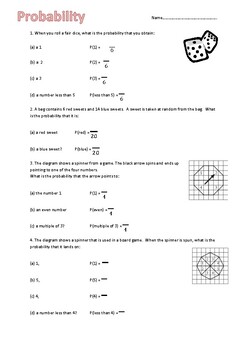
FREEBIE! - Scaffolded basic probability worksheet
This worksheet is perfect for low ability, SEN and struggling students to help support them in finding basic probabilities. The worksheet has fractions included and students have to fill in the missing spaces. A good supporting worksheet for an intro into probability. Answer key included.
Subjects:
Grades:
7th - 9th
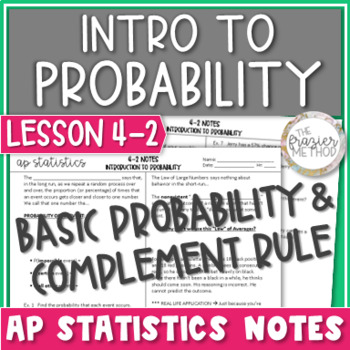
AP Statistics Notes Intro to Probability Basic Probability & Complement Rule
AP Statistics notes on BASIC PROBABILITY & COMPLEMENT RULE for FREE!!! Define and calculate the probability of a single event, the probability of the event’s complement, and the probability assignment rule as it applies to sample space. Also included is the Law of Large Numbers.Aligns with AP College Board's objectives and standards for AP Statistics Unit 4: Probabilities, Random Variables, & Probability Models. WHAT’S INCLUDED IN THIS PRODUCT?Lesson 4-2: Probability Rules Part 1 – Intro
Subjects:
Grades:
10th - 12th
Also included in: AP Statistics Notes Unit 4 Bundle - Probability Rules & Random Variables
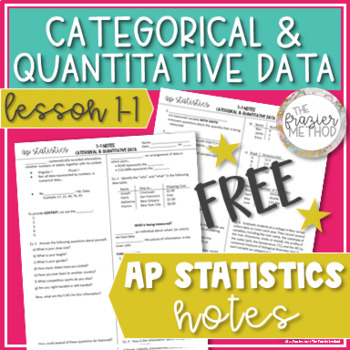
AP Statistics Notes - Categorical and Quantitative Variables, Data Table, FREE
With definitions, examples, & practice problems, these AP Statistics notes will help you teach or review CATEGORICAL & QUANTITATIVE VARIABLES whether you’re teaching in-person or distance learning! Students will define data, context, cases, records, respondents, subjects, participants, experimental units, and variables. In addition to distinguishing between categorical, quantitative, and identifier variables, AP Statistics students will write a context sentence using the 5 W’s and identi
Subjects:
Grades:
9th - 12th
Types:
Probability Addition Rules Guided Notes (Mutually Exclusive and Overlapping)
Probability Addition Rules Guided Notes
This set of guided notes focuses on finding the probability mutually exclusive and overlapping events. All of the problems feature the key word "OR." For example, students might have to find the probability of choosing an ace or a spade from a standard deck of cards.
These fill in the blank notes include 3 examples and 5 practice problems. I have included the full size notes as well as the notes printed 2 to a page, which fits well in a spiral notebook
Subjects:
Grades:
6th - 12th
CCSS:
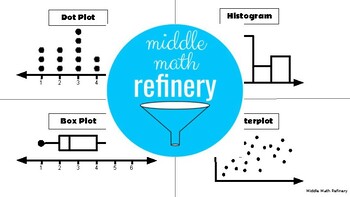
Printable: Types of Graphs (Dot Plot, Histogram, Box Plot, Scatterplot)
This easy-to-use resource features the four (4) types of graphs students learn about in middle school math and high school statistics: dot plots, histograms, box (or box and whiskers) plots and scatterplots. Great to use for scaffolded notes or on your word wall!Features:One (1) blank/ fillable page with missing names of graphsAnswer key with labels
Subjects:
Grades:
6th - 10th
CCSS:
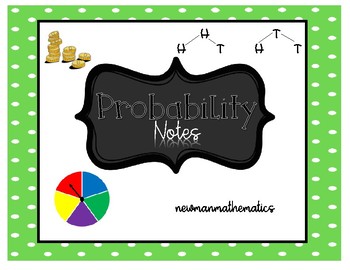
Probability Notes
Great notes to introduce probability!
These notes cover the concepts:
-Probability
-Theoretical Probability
-Experimental Probability
-Probability Trees
Spinner's are provided if you choose to use them for your experimental probability. Just copy in color onto cardstock and cut out. Use a pencil and a paperclip as the spinner.
Enjoy!
Subjects:
Grades:
6th - 10th
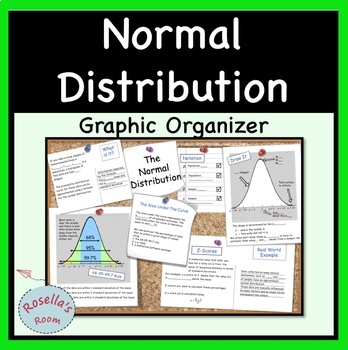
Normal Distribution Graphic Organizer
This graphic organizer summarizes:- properties of the normal distribution- the 68-95-99.7 rule- z-scoresIncluded are three scaffolded versions of the same graphic organizer; two are designed for students to fill in (one is left blank and the other has missing text) and the third is complete with all text. Great for revision.
Subjects:
Grades:
9th - 12th, Higher Education, Adult Education
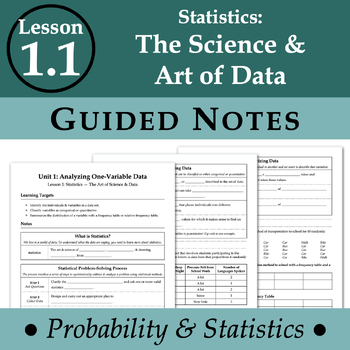
Statistics: The Science & Art of Data (ProbStat - Lesson 1.1)
Statistics: The Science & Art of Data GUIDED NOTESThis is lesson 1 in Unit 1 Analyzing One-Variable Data.What is included?Guided NotesExamplesCumulative "Check Your Understanding" PracticeTyped KeyLesson ObjectivesIdentify the individuals & variables in a data set.Classify variables as categorical or quantitative.Summarize the distribution of a variable with a frequency table or relative frequency table.
Subjects:
Grades:
9th - 12th
Also included in: Unit 1 Analyzing One-Variable Data NOTES BUNDLE (ProbStat)

Mean Median Mode Range Notes
Filled in notes on mean, median, mode, and range with examples of each.
Graphics from mycutegraphics.com
Subjects:
Grades:
5th - 10th
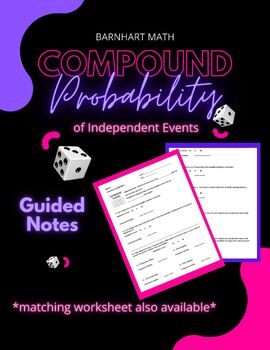
Compound Probability Guided Notes (Independent Events)
Compound probability guided notes (matching worksheet available).
Subjects:
Grades:
8th - 11th
Types:
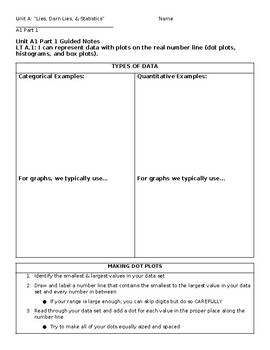
Probability and Statistics Unit A Notes and Practices
Probability and Statistics Unit A Notes and Practices
Subjects:
Grades:
9th - 12th
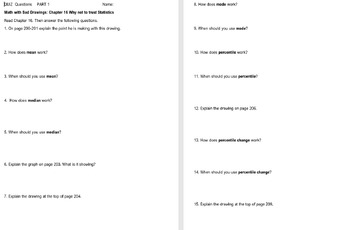
Guided Reading or Quiz Questions w/ Chapter 16 of Math With Bad Drawings
After working on our statistics unit for a few days I put students in groups they are comfortable reading with. I give them 20 minutes to popcorn-read with their group and discuss the cartoon drawings. Then I give them these questions. I separate them into the 2 parts for groups who need to get fewer questions at a time and give both parts to the ones that are better and doing a whole packet at once. I have used the last question to launch a statistical project of their own or just as a class di
Subjects:
Grades:
9th - 12th
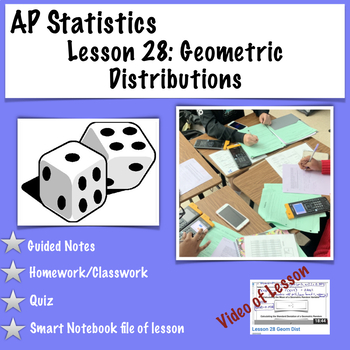
AP Statistics. Geometric Distributions (with video of lesson)
This product contains lesson 28 of the AP Statistics Curriculum and the second lesson in Unit 4 (follows College Boards® new format).If you are interested in purchasing the whole curriculum, visit my store. I sell the whole curriculum with videos of the lessons and without videos. Included in this download:-Guided Notes-Lesson Key-SMART notebook file of the guided notes to fill in with students-Assignment (Homework/Classwork)-Lesson Quiz-Video of lessonThese lessons are also sold without a video
Subjects:
Grades:
9th - 12th
Also included in: AP Statistics Curriculum Mega Bundle (with videos of each lesson)
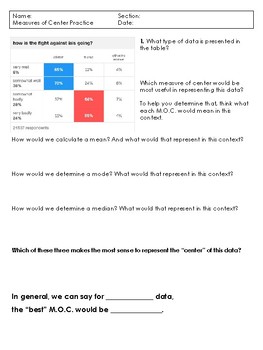
Determining Measures of Center
Students look at different types of data collected, categorize them, and determine which measure of center (mean, median, mode) works best. Students come up with general rules for nominal, ordinal, and quantitative data. Practice problems at the end have them use this new knowledge.
Subjects:
Grades:
9th - 11th
CCSS:
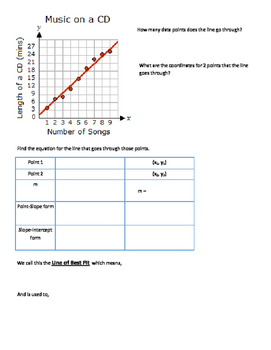
Line of Best Fit Example/Notes
Using students prior knowledge of linear functions, this example helps them recall and walk through an example to find the linear equation for the line of best fit.
Subjects:
Grades:
6th - 10th, Adult Education
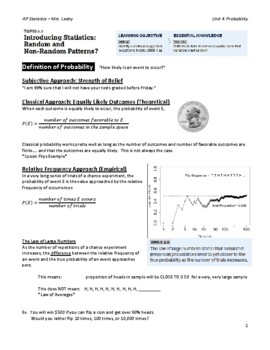
AP Statistics Unit 4 Guided Notes (Probability, Random Variables, Distributions)
AP Statistics Unit 4 Guided Notes (Probability, Random Variables, Distributions)Free Download of Guided Notes for AP Statistics - aligned to College Board Unit 4 topics.
Subjects:
Grades:
9th - 12th
Types:
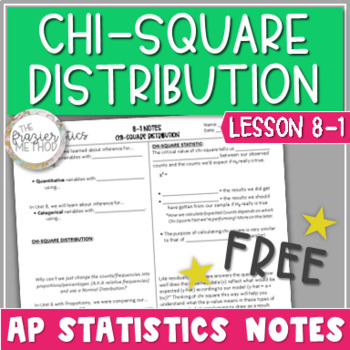
AP Statistics Notes Chi-Square Distribution / Chi-Square Model FREE
AP® Statistics notes on an introduction to the CHI-SQUARE DISTRIBUTION / CHI-SQUARE MODEL! Students will distinguish between when to use a Chi-Square Distribution, Normal Distribution, or T-Distribution, as well as learn the chi-square formula and how to interpret a chi-square value. You can also use these notes as a review or as AP® Stats Exam prep! Aligns with objectives and standards for AP® Statistics Unit 8: Inference for Categorical Data – Chi-Square. WHAT’S INCLUDED IN THIS PRODUCT?Lesso
Subjects:
Grades:
10th - 12th
Types:
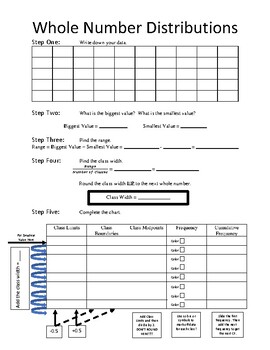
Frequency Distributions Guided Directions
These guided directions help students to create a whole number frequency distribution chart. The information can help students organizing data and putting data into histograms, frequency polygons, and ogives (cumulative frequency graphs).
Subjects:
Grades:
9th - 12th, Higher Education
Types:
CCSS:
AP Statistics-Introduction to Significance Tests (Lesson only)
Students will: -Identify the null and alternative hypotheses for a significance test about a population -Interpret a P-value in the context of the problem -Make an appropriate conclusion based on a significance level -Determine if results are statistically significant -Describe Type I and Type II errors along with giving the consequences of each of the errors.My lessons are guided notes with keys. Full lessons come with homework/classwork and SMART notebook file
Subjects:
Grades:
9th - 12th
Organizing and Visualizing Data: Population, Sample, Frequency, Graphs and Plots
z
Subjects:
Grades:
8th - 12th
CCSS:

Notes and examples: Ordering, Combinations, and Permutations
Slide deck to go along with the YouTube video found at https://www.youtube.com/watch?v=m1SKijvXru0
Subjects:
Grades:
10th - 12th, Adult Education
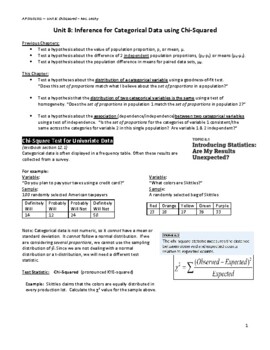
AP Statistics Unit 8 Guided Notes (Chi-Squared, Inference Categorical Data)
AP Statistics Unit 8 Guided Notes (Inference for Categorical Data - Chi Squared)ChiSquared Tests: Goodness of Fit (1 variable, 1 population), Homogeneity (1 variable, 2 populations), and Independence (2 variables, 1 population)Free Download of Guided Notes for AP Statistics - aligned to College Board Unit 8 topics.
Subjects:
Grades:
9th - 12th
Types:
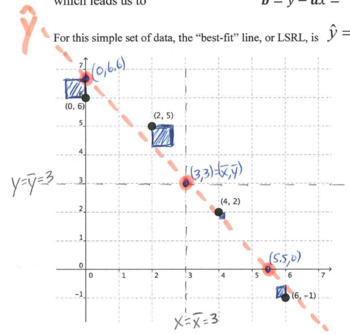
Statistics Lesson: Introduction to Correlation and Linear Regression
Guided notes for introducing correlation and linear regression, students will be actively engaged in the calculations and the visualization of the "least-squares regression line" (LSRL).
Subjects:
Grades:
10th - 12th
Showing 1-24 of 34 results


