40 results
Free high school statistics graphic organizers
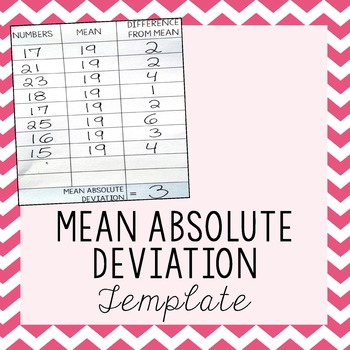
Mean Absolute Deviation Template
I created this template to help my students work through the steps of calculating Mean Absolute Deviation. The helped my students immensely and I hope it will help yours as well.I hope you will explore my other Mean Absolute Deviation products to help complete your unit:Mean Absolute Deviation MazeMean Absolute Deviation Activity with Zombies!Related Resourceso Click Here for more 8th Grade Math activitiesThis product is also part of the following money saving bundle:8th Grade Math Bundle - All
Subjects:
Grades:
6th - 12th
Types:
Also included in: 8th Grade Math Bundle ~ All My 8th Grade Math Products at 1 Low Price
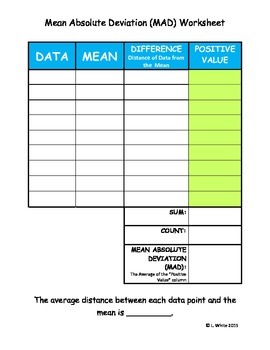
{FREE} Mean Absolute Deviation (MAD) Worksheet
Use this worksheet as a guide to help students solve Mean Absolute Deviation Problems. I placed the worksheet into plastic slip covers and allowed my students to write on the document using dry erase markers. My students found this tool to be very resourceful!
The steps to find the MAD include:
1. find the mean (average)
2. find the difference between each data value and the mean
3. take the absolute value of each difference
4. find the mean (average) of these differences
This worksheet allow
Subjects:
Grades:
7th - 9th
Types:
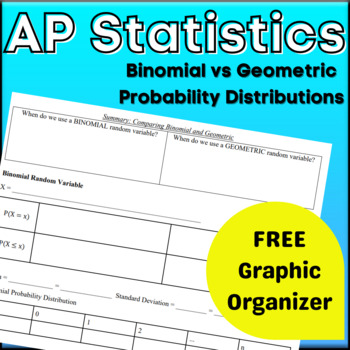
AP Statistics Binomial vs Geometric Probability FREE Organizer
AP StatisticsUnit 4 Probability, Random Variables, and Probability DistributionsFREE Binomial vs Geometric Probability Distribution Organizer Enjoy this FREE resource! Included in this zip folder is the PDF and Microsoft Word version of this one-page organizer. ***************************************************************************************Interested in more? Check out my unit bundles! Unit 1 - Exploring One Variable DataUnit 2 - Exploring Two Variable DataUnit 3 - Collecting DataUnit 4 -
Subjects:
Grades:
10th - 12th
Types:
CCSS:
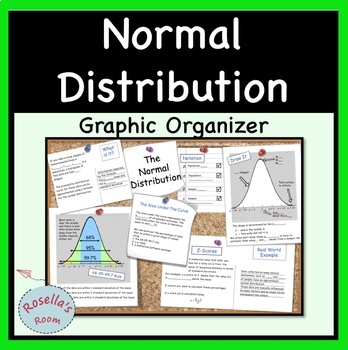
Normal Distribution Graphic Organizer
This graphic organizer summarizes:- properties of the normal distribution- the 68-95-99.7 rule- z-scoresIncluded are three scaffolded versions of the same graphic organizer; two are designed for students to fill in (one is left blank and the other has missing text) and the third is complete with all text. Great for revision.
Subjects:
Grades:
9th - 12th, Higher Education, Adult Education
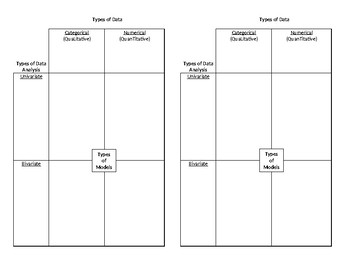
Intro to Data Analysis Graphic Organizer
I created this template for an introduction to my data analysis unit in Algebra I. We discuss and define categorical vs. numerical data, univariate vs. bivariate analysis, and the different graphs or models that apply to each. Since we use Interactive Notebooks, it is designed to be half a page.
Subjects:
Grades:
7th - 12th
CCSS:

Histograms on the TI-84 Graphing Calculator Reference Sheet Freebie
FREEBIE Statistics Creating Histograms on the TI 83 84 PlusThis easy to follow handout helps your students learn to use the TI 83 - 84 Plus Graphing Calculator to enter data into lists and create histograms from a list of data, and to customize them. Great for Algebra, Statistics, AP, Regular and Dual Enrollment, and for the SAT. There are two versions, one for the TI 83 Plus and the second supports for newer OS of the TI 84 Plus.These can be used as Binder Notes or printed two to a page for
Subjects:
Grades:
9th - 11th
CCSS:
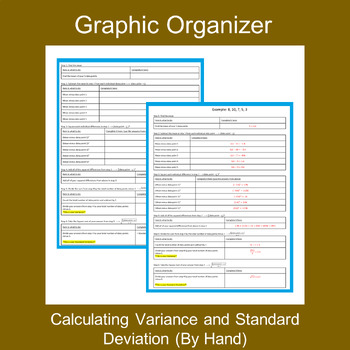
Graphic Organizer: Calculating Variance and Standard Deviation by Hand
This helpful graphic organizer can be used to walk students through the step-by-step process of calculating Variance and Standard Deviation by hand.Example Included!
Subjects:
Grades:
9th - 12th
Types:
CCSS:
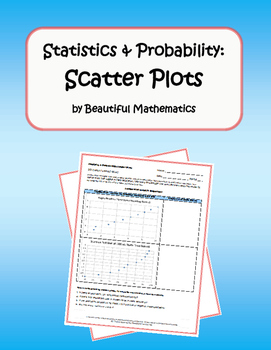
Statistics & Probability: Scatter Plots
Students will learn that straight lines are widely used to model relationships between two quantitative variables. For scatter plots that suggest a linear association, informally fit a straight line, and informally assess the model fit by judging the closeness of the data points to the line.Provide feedback and get TPT credit on future purchases:***Go to your My Purchases page. Click on the Provide Feedback button beside each purchase. You will be taken to a page where you can give a quick ratin
Subjects:
Grades:
7th - 9th
CCSS:
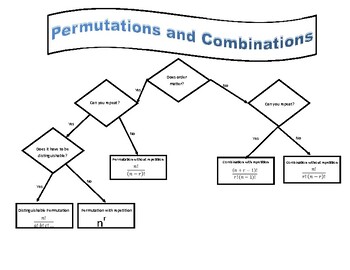
Permutation and Combination Flow Chart
Included is a blank chart and an answer key. Students have a hard time knowing which one is which and this flowchart helps take out the guess work.Includes:Permutations with repetitionPermutations without repetitionDistinguishable PermutationsCombinations with repetitionCombinations without repetition*Updated 05/05/2023 to correct typo
Subjects:
Grades:
9th - 12th, Higher Education
Types:
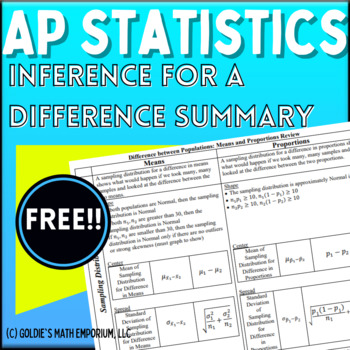
FREE AP Statistics Difference in Populations Summary
Differences in Populations Summary in AP StatisticsThis FREE resource will let you review the following in an easy organizer:two sample z intervals for proportionstwo sample z tests for proportionstwo sample z and t intervals for meanstwo sample z and t tests for meansIn this resource, you will get the editable WORD version of the summary, the PDF version, as well as an annotated answer key. You can use this resource after teaching confidence intervals or use it as AP Exam review.***************
Subjects:
Grades:
10th - 12th
Mean Absolute Deviation (MAD) Chart Template
A student organizer to help when calculating the mean absolute deviation of a data set. Used throughout the unit so that struggling students have an organizer for the data sets.Mean absolute deviation is a difficult concept for lower students, so I created these charts to help my students. Students were allowed to use these charts on homework, in class assignments, and assessments. I was told by many students that these charts were helpful to keep the data organized.For every one page, it holds
Subjects:
Grades:
6th - 9th
CCSS:
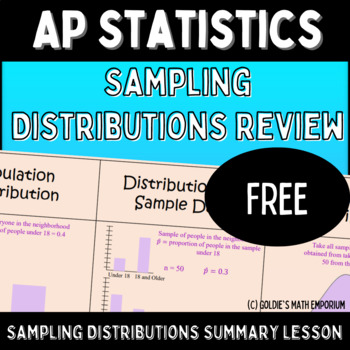
Sampling Distributions Review Lesson - FREE!!!
Sampling Distributions Review Lesson - FREE In this FREE lesson, you get teacher slides and a student handout to help review all the material involved when teaching Sampling Distributions.In this zip folder, I have included the following:Teacher Slides (PowerPoint) of all the information involved when teaching Sampling DistributionsWord Document of the student handoutPDF Document of the student handoutPDF Document of the answer key*****************************************************************
Subjects:
Grades:
10th - 12th
Types:
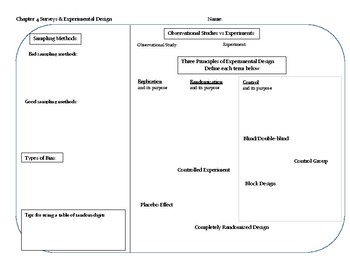
Surveys and Experimental Design Graphic Organizer
This graphic organizer places all survey and experimental design concepts for AP Statistics on one convenient page. Excellent for brainstorming or review, for a unit test or for the AP Exam at year-end. Concepts included: sampling methods, bias, observational studies versus experiments, three principles of experimental design, blinding, placebo, etc. A possible answer key is provided, but additional information could be easily discussed or added. A full set of graphic organizers for the year is
Subjects:
Grades:
10th - 12th
CCSS:
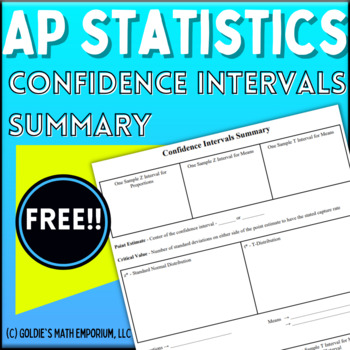
FREE AP Statistics Confidence Intervals Summary
Confidence Intervals Summary in AP StatisticsThis FREE resource will let you review the following in an easy organizer:one sample z intervals for proportionsone sample z and t intervals for meansIn this resource, you will get the editable WORD version of the summary, the PDF version, as well as an annotated answer key. You can use this resource after teaching confidence intervals or use it as AP Exam review.***************************************************************************************Th
Subjects:
Grades:
10th - 12th
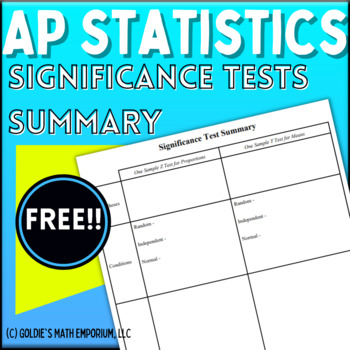
FREE AP Statistics Significance Tests Summary
Significance Tests Summary in AP StatisticsThis FREE resource will let you review the following in an easy organizer:one sample z tests for proportionsone sample z and t tests for meansIn this resource, you will get the editable WORD version of the summary, the PDF version, as well as an annotated answer key. You can use this resource after teaching confidence intervals or use it as AP Exam review.***************************************************************************************This FREE re
Subjects:
Grades:
10th - 12th
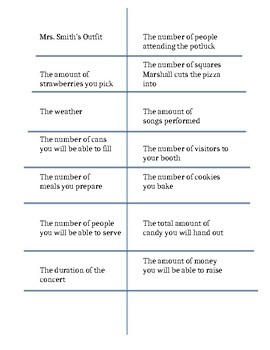
Independent vs. Dependent
Worksheet for teaching independent and dependent. I used this as a whole group activity to transition into group work. My class had a lot of trouble with understanding this material, but they liked having more examples than the two that were shown in the book. Hope this helps your students as much as it helped my students (and my sanity).
Subjects:
Grades:
5th - 12th
CCSS:
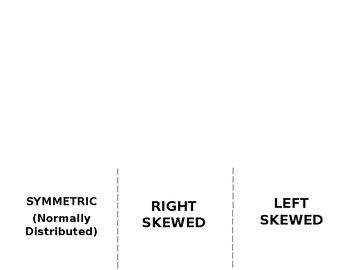
Distribution Shapes Foldable
Goes with Bluman Statistics book end of section 3-1.
Subjects:
Grades:
11th - 12th

Experimental Designs Flow Chart
Flowcharts can be used to help students distinguish between the 3 types of experimental design used on the AP Statistics Test (completely randomized design, block design and matched pairs design). Used as notes in class (can be used with interactive notebook) as well as in doing examples to help students diagram experiments.
Subjects:
Grades:
9th - 12th
Pie Chart Notes Descriptive statistics AP Statistics
Guided notes for pie charts. This is Unit 1: lesson 3a in the AP Statistics Curriculum.Included in this resource:Interactive notebook pages Guided notesPractice ("try it") pages for individual or partner workNotesAnswer keyTopics included:Construct a pie chartInterpret a pie chartThis resource can be found in the following bundles:AP Statistics CurriculumAP Statistics Unit 1AP Statistics Unit 1 Notes OnlyGet students ready for the AP Statistics exam with the full curriculum. Questions? Leave y
Subjects:
Grades:
9th - 12th
CCSS:
Also included in: Descriptive Statistics AP Statistics
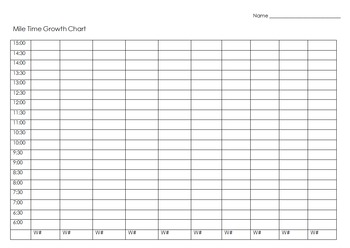
Mile Time Growth Chart
Help your students monitor their own growth in running a timed mile by giving each of them this chart. It can easily be incorporated into math (graphing, statistics, data analysis), or paired with any Growth Mindset teaching in PE. Enjoy!
Subjects:
Grades:
1st - 12th
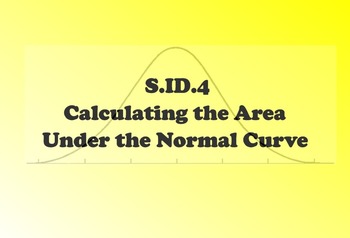
SID.4 Calculating the Area Under the Normal Curve.
This lesson teaches students how to use the mean and standard deviation of a data set to create a normal curve and how to calulate the area (population percentage) under the normal curve given a range of values.
This lesson includes a SMART Notebook Presentation, guided notes with class work problems, and an answer key. The guided notes correspond with the SMART Notebook Presentation.
Subjects:
Grades:
9th - 12th
CCSS:

Describing Data Organizers
These two organizers will help students synthesize the many different graphs and measures they have learned about in a unit on descriptive statistics. Blank and completed organizers are included. Good for a unit review or as a group or individual assignment.
Subjects:
Grades:
11th - 12th
Types:
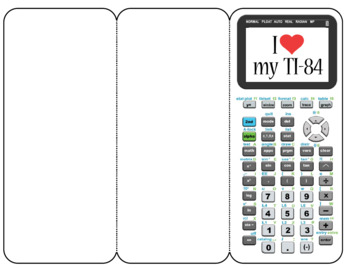
Ti-84 Foldable
I have students glue this foldable onto their folder and use it as a place to keep up with tips and tricks we learn about the calculator. Sometimes, I'll print certain instructions out (like systems with matrices). This way, they always know where to find "that page".I print the pdf front and back, flipping it on the short edge. I am including pictures of how it folds up and I am happy to answer any questions!
Subjects:
Grades:
7th - 12th, Higher Education
Types:
Showing 1-24 of 40 results


