63 results
Free high school statistics assessments
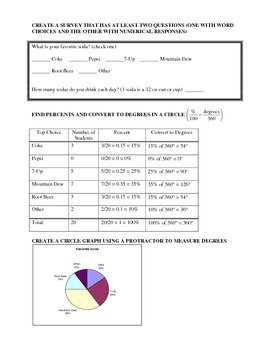
Construct a Survey Lesson/Project Plan
This PDF document consists of three parts: a lesson plan, project instructions, and a grading rubric. The lesson has students construct a survey that will have at least two questions: one that is multiple choice and one that has a numerical answer. It can either be an individual assignment or a group assignment and takes 2-3 days. I used this towards the end of the year as a review exercise since it covers multiple concepts: percents, circle graphs, central tendency (with outliers), box-and-whis
Subjects:
Grades:
6th - 9th
Types:
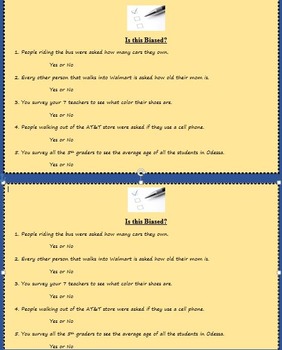
Is this Biased? (populations and random samples)
This is a 5 question quiz, exit ticket, do now, or homework assignment that reviews how surveys and samples can be biased sometimes. All 5 can be answered with a yes or no for whether it is indeed a biased survey. Enjoy and please rate and/or comment on this product!
Subjects:
Grades:
5th - 9th
Types:
Interquartile Range (IQR) & Box-and-Whisker Plot Review
This is a half sheet document with four questions to review both interquartile range and box-and-whisker plots. Can be used in an interactive notebook or as an exit ticket.No teacher prep for one page in an interactive notebook! Or you may use it as a quick exit ticket at the end of a class period. Very flexible with how you want to use the four questions. Save paper with the one sheet to two students ratio!Answer key is included for all four problems.I want to improve my products. If you have a
Subjects:
Grades:
6th - 9th
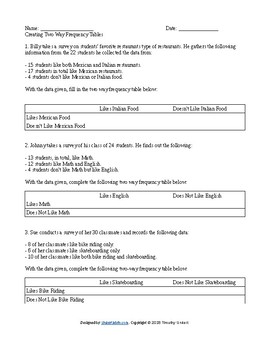
FREE Two-Way Frequency Tables Worksheet! (HSS.CP.A.4)
In this FREE worksheet students tackle 6 problems where they must complete (fill in) empty two-way frequency tables. Can be used as a worksheet, homework, or as an assessment! Answer key included. Aligns with Common Core Standard HSS.CP.A.4. Four pages total including answer key.
Subjects:
Grades:
8th - 10th
Types:
CCSS:
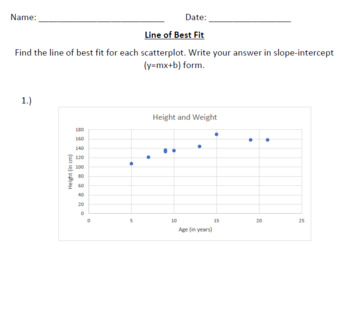
Line of Best Fit Practice
Every practice I have seen for line of best fit asks students to create the scatter plot and then find the line of best fit. However, this takes significantly longer. I created these scatter plots to give students a chance to focus specifically on creating a line of best fit and finding the slope-intercept equation of the line. I have attached the PDF and Word version (for editing), as well as an answer key. Please keep in mind that answer may differ depending on which points are chosen to calcu
Subjects:
Grades:
7th - 9th
Types:
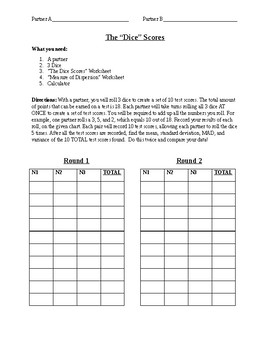
Dice Activity for Standard Deviation
This is a great activity that helps the students understand standard deviation! With a partner, the students will roll 3 dice to create a set of 10 test scores. The total amount of points that can be earned on a test is 18. Each partner will take turns rolling all 3 dice AT ONCE to create a set of test scores. They must add up all the numbers they roll. For example, one partner rolls a 3, 5, and 2, which equals 10 out of 18. Record your results of each roll, on the given chart. Each pair will r
Subjects:
Grades:
7th - 12th
Types:
CCSS:
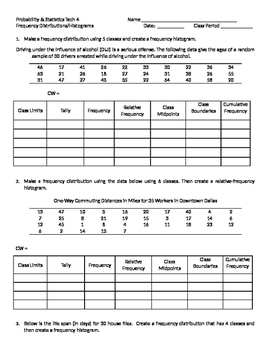
Frequency Distributions Practice
This worksheet gives students practice on making frequency distribution tables. I used this same sheet in my Prob & Stats class, and we also used the same tables to make frequency and relative frequency histogram, frequency polygons, and cumulative ogive graphs.
Subjects:
Grades:
10th - 12th
Types:
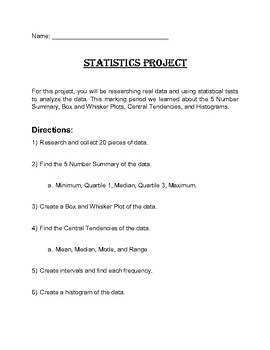
Statistics Project and Gallery Walk: Data, Box Plot, 5 Number Summary, Histogram
Need a summative assessment for your statistics class?This Statistics Project is a great way for students to show their knowledge of gathering and collecting data, calculating 5 Number Summary, creating Box and Whisker Plots, analyzing Central Tendencies, and graphing Histograms. Students can pick their own topic, create a poster of their data, and then present their findings to the class through a Gallery Walk.Example project is included.
Subjects:
Grades:
7th - 10th
Types:
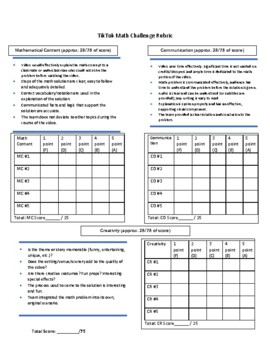
Tik Tok Math Challenge
Students must work either independently or in groups to describe and communicate a mathematical topic as a TikTok style video- a unique short video clip (less than 1 minute) that provides accurate knowledge and understanding of a math concept. Students should be creative and have fun, include music, visuals, , text, and other cinematic effects. You could use this in place of a test grade, as a project, or as a review.
Subjects:
Grades:
7th - 12th
Types:
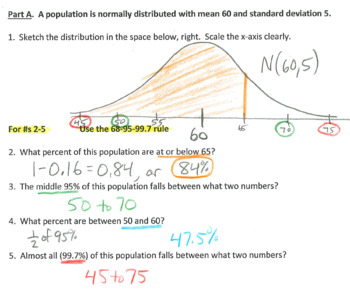
Statistics Quiz: the normal distribution
One practice quiz (with answer KEY!) and two forms of a "real quiz" (answer KEYs provided!) on the normal distribution. Students must sketch and label a bell curve, use the 68-95-99.7 rule, compute z-scores and use a z-table (commonly referred to as "Table A").
Subjects:
Grades:
9th - 12th
Types:
Digital SAT Math Prep for Probability
This is the probability chapter from my book "Overcoming Digital SAT Math" by Sophia Garcia. It contains 9 mostly SAT-style math questions. Bundle and save by getting my entire Digital SAT Math Workbook or just get my SAT math quizzes here!Make sure to follow my store for monthly freebies and updates on new products >> CLICK HEREOther Information: Please note that some (not all) of these problems are also included in my ACT Math Workbook because a lot of the same topics are tested on both
Subjects:
Grades:
9th - 12th
Types:
Also included in: SAT Math Prep Workbook for Digital SAT
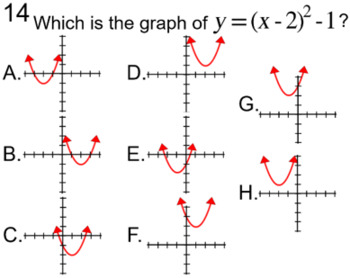
9 Free Socrative High School Math Assignments for PDF
600 Socrative Assignments for HS Math, Parts 1-24 for PDFI added 5 Common Functions Assignment #1. It is a 24 question assignment over the graphs of y=x², y=√x, y=|x|, y=e^x and y=x³. Update I added a video Introduction to a System of Equations with an accompanying Socrative assignment.Update I added a YouTube explanation of the odd solutions to Slope, Distance, Midpoint, Degree Assignment #3 Update I added a YouTube explanation of the odd solutions to Advanced Word Problems Assignment #2C.Upd
Subjects:
Grades:
8th - 11th
Types:
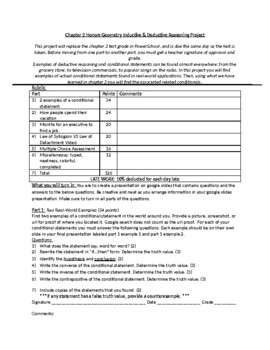
PBL for Reasonings and Proofs
Finding statements and converting them to if-then form and writing conditionals. Comparing inductive and deductive reasoning to answer questions about real-world examples. Comparing the Law of Syllogism with the Law of Detachment.
Subjects:
Grades:
9th - 12th
Types:
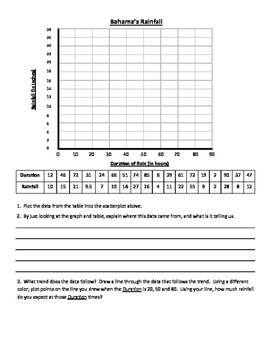
Bahama's Rainfall Scatter Plot
Students plot data about Bahama's Rainfall and answer questions. There is nothing except a blank graph and table for students to use and explain what the graph and table tell them. Great to see how well students are able to read graphs and tables.
Subjects:
Grades:
6th - 10th
Types:
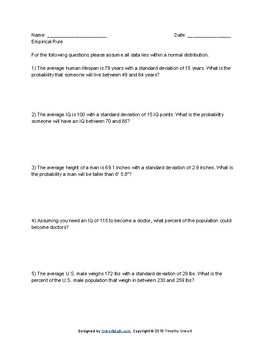
FREE Worksheet (for a limited time) on the Empirical Rule - HSS.ID.A.4
In this free (for a limited time) worksheet students answer 10 questions about normally distributed data using the Empirical Rule to look at the probability of being in between standard deviations on the normal curve. Answer key included. 4 pages total.
Subjects:
Grades:
10th - 12th
Types:
CCSS:
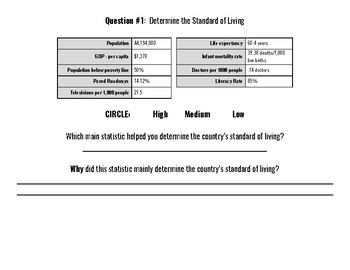
Standard of Living Statistics Analysis
Practice determining a country's standard of living by analyzing their statistics:
GDP
GDP per capita
Population below the poverty line
Life expectancy
Doctors per 1,000 people
Infant Mortality Rate
Literacy Rate
When I did this with my students, I looked more for their explanation behind their reasoning rather than a "correct" answer.
We did a statistic relay challenge, but students asked to do these on their own in their spare time to continue practicing reading statistics. This is great pr
Grades:
7th - 12th
Types:
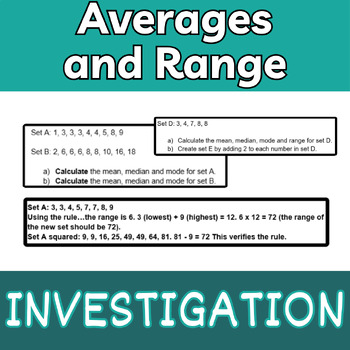
Moving Averages Investigation (MYP criterion B)
In this investigation, students are required to use their knowledge of averages and range to investigate the relationship between how a set of numbers change (multiplication, addition, square) and how the averages and range change.Including the assessment, task specific clarification, and answer key.Recommended for MYP2/3.
Subjects:
Grades:
6th - 9th
Types:
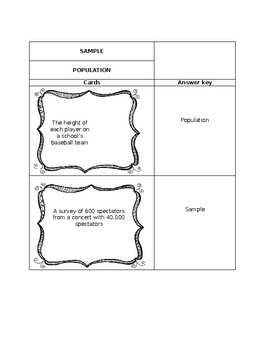
Population or Sample Card Sort
The basic foundation for hypothesis testing and other types of inferential statistics students must understand how a sample and a population differ.
Subjects:
Grades:
6th - 12th
Types:
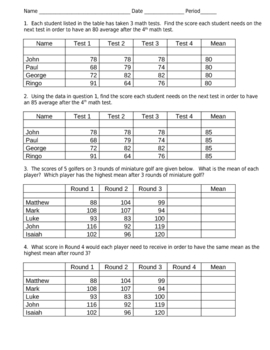
Measures of Central Tendencies - Find the Missing Mean problems
Looking for some problems to help teach students to find the missing mean?
Subjects:
Grades:
5th - 10th, Higher Education, Adult Education
Types:
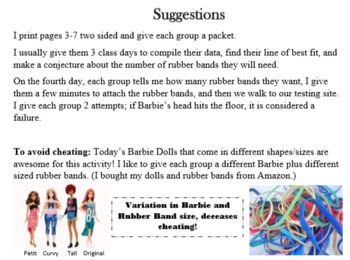
Linear Regression: Barbie Bungee
Students will use rubber bands and Barbie dolls to simulate a bungee jump.
To begin the activity, students are given 1 Barbie and 3 rubber bands per group. After collecting data on three "jumps" they will calculate a linear regression to best represent the data.
They will be asked to use their regression equation to estimate the amount a rubber bands needed to make a bungee jump of your choice.
I always have the students test their equations by "bungee jumping" Barbie from a specific schoo
Subjects:
Grades:
8th - 12th
Types:
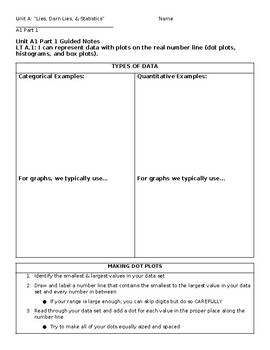
Probability and Statistics Unit A Notes and Practices
Probability and Statistics Unit A Notes and Practices
Subjects:
Grades:
9th - 12th
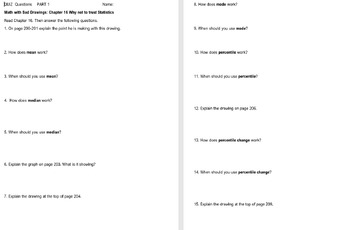
Guided Reading or Quiz Questions w/ Chapter 16 of Math With Bad Drawings
After working on our statistics unit for a few days I put students in groups they are comfortable reading with. I give them 20 minutes to popcorn-read with their group and discuss the cartoon drawings. Then I give them these questions. I separate them into the 2 parts for groups who need to get fewer questions at a time and give both parts to the ones that are better and doing a whole packet at once. I have used the last question to launch a statistical project of their own or just as a class di
Subjects:
Grades:
9th - 12th
Parameters vs Statistics
This is my first upload. It is a brief lesson on the difference between populations and samples, parameters and statistics. Included are notes, a guided note sheet for students, homework, and answer keys. Enjoy and please feel free to give me feedback. I am just getting started with this and hope to upload many more lessons for Introductory and AP Statistics!
Subjects:
Grades:
7th - 12th
Types:
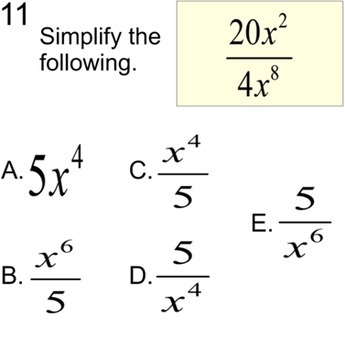
7 Free Socrative Math Quizzes Monomials, Venn & 2 Way Tables for Power Point
600 Power Point Assignments BundleIncluded in this zip folder are 7 free quizzes in Power Point files. The quizzes can be used at socrative or printed.Quiz 1 is a 20 question multiple choice quiz with all exponents positive. The student has to add, subtract, multiply, divide and raise to powers monomials. The Socrative share number is at the top of the page.Quiz 2 is a 20 question multiple choice assignment over adding, subtracting, multiplying, dividing, and raising to powers single term alg
Subjects:
Grades:
8th - 11th
Types:
Showing 1-24 of 63 results


