13 results
Free high school statistics laboratories
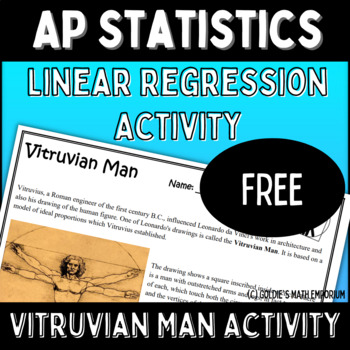
FREE AP Statistics Activity - Intro to Linear Regression
Introduction to Linear RegressionVitruvian Man ActivityThis is a FREE resource that I use to introduce linear regression in my AP Statistics and regular-level statistics course.There are two parts to the Vitruvian Man activity. The first part is the activity we complete together in class, and the second part is the homework assignment students take home to complete.In the first part, students gather the class's data on their height and their armspan. They plot the data and are taken through the
Subjects:
Grades:
10th - 12th
Types:
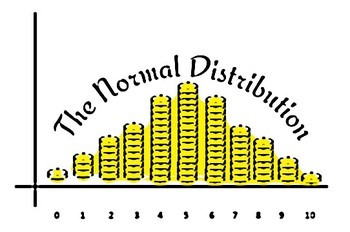
The Normal Distribution - Made Easy
This activity requires students to flip a coin 100 times, exchange data with other students, and create a frequency table based on the results. Students should be able to recognize the structure of a normal distribution curve and explain how the associated statistics � mean, median, mode, etc. � relate to the probability of flipping a coin. Students practice creating frequency tables, constructing histograms, and interpreting data. Teachers may use this activity
Subjects:
Grades:
7th - 12th
Types:
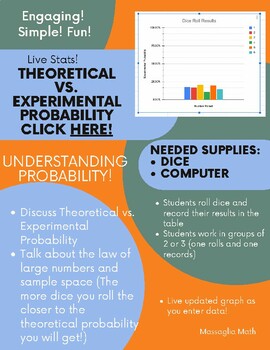
Experimental vs Theoretical Probability
Have your students roll dice and look at the data. Discuss the theoretical probability of rolling a 1 vs experimental probability. What happens as the same size increase?Students work in groups of 2 or 3 and record their data. You can have everyone tell you their data and type it in, or you can have the students type their data into the shared google sheet. As they type the stats will update live and they have a graph showing them each roll. *Note: If you don't have dice you can use an online di
Subjects:
Grades:
8th - 12th
Types:

AP - X-Files PowerPoint
This is the PowerPoint I use to explain the X-files lab. It has a video at the end from X-files the movie. I've also uploaded the soundtrack to the title slide.
Subjects:
Grades:
10th - 12th
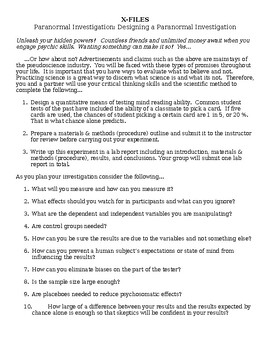
AP - X-Files Lab Sheet Directions
The lab sheet with directions I give to the students.
Subjects:
Grades:
10th - 12th
Types:
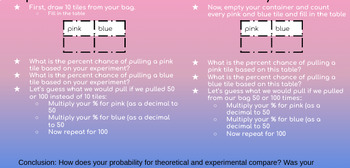
Experimental vs Theoretical Probability (FREE VERSION)
Here is a short little activity that I came up with to help students understand the Law of Large Numbers and the Difference between Experimental and Theoretical Probability. Cut out the pink and blue "tiles" or squares of paper/cardstock. I typically use 15 pink and 20 blue for this activity. The "pink" tiles are for cats and the "blue" tiles are for dogs.
Subjects:
Grades:
11th - 12th
Types:

Powerball Lottery Lab
This is a lab for statistics. Topics covered include histograms, specifically histograms with uniform distribution. Students will also explore theoretical and empirical probability as well as expected values.
I created this lab to be used with Statcrunch but it can be adapted for Excel or any other software that students can use to manipulate large files. You can go to this link (http://www.nc-educationlottery.org/powerball.aspx) and then click "Download Results" to get a csv file of all the
Subjects:
Grades:
9th - 12th, Higher Education, Adult Education
Types:
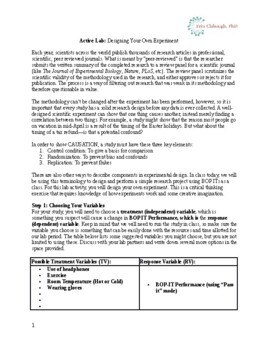
BOP-IT Experimental Design Lab Group Activity w/Excel Statistics BIOLOGY PSYCH
Science is best taught by doing science! This experimental design lab walks students through designing a proper science experiment using BOP-it toys, including the actual data collection and subsequent analysis using Excel. The activity is collaborative, student-driven, hands-on, and the outcome is not predetermined. First, the lab teaches the required elements to determine cause and effect. Then, the entire class chooses the independent variable and lab groups are assigned to an experimental co
Subjects:
Grades:
10th - 12th, Higher Education
Types:
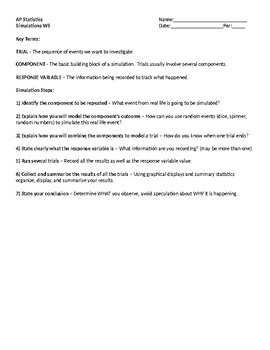
AP Statistics: Simulation Lab Worksheet
This activity provides the basics of creating and running a random simulation. There are key terms as well as a defined procedure to follow. The questions are scaffolded to assist in completion and the level of scaffolding decreases as the worksheet progresses. AP Statistics Unit 3: Collecting Data.
Subjects:
Grades:
10th - 12th
CCSS:
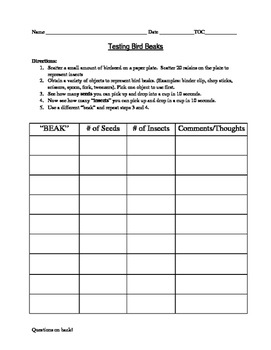
Bird Beak Variation Lab
This lab is a great inquiry activity demonstrating variation in bird beaks. This relates directly to instruction involving Darwin, natural selection, and variation.
Subjects:
Grades:
5th - 9th
Types:
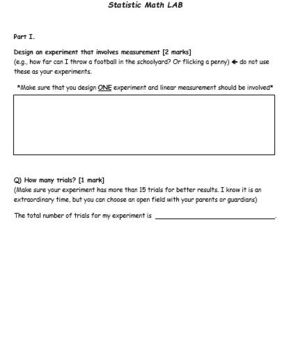
Statistic Math Lab (for Jr high math)
This is an activity-based statistic lab for grade 7, 8, or 9 statistics.The worksheet includes problems thatmainly focus on the following outcomes:1. Mean2. Median3. Mode4. RangeThis worksheet works best as a review activity near the end of the statistic unit.
Subjects:
Grades:
7th - 9th
Types:
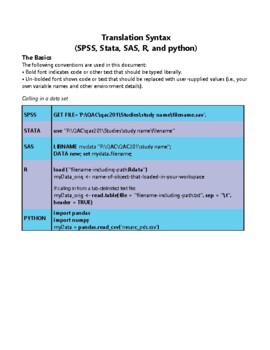
STATA software Secondary Data Analysis
This handout is intended for those interested in teaching/learning basic introductory statistics concepts to analyze real data. Students will learn how to tell a story using secondary data analysis. The handout is for STATA software and the US Longitudinal Study of Adolescent Health data set. For handouts on setting up an account, the data set code book and raw data file, a PowerPoint to accompany the handout, or questions please email kristin.flaming@gmail.com or ldierker@wesleyan.edu.This
Grades:
6th - 12th, Higher Education, Adult Education
Types:
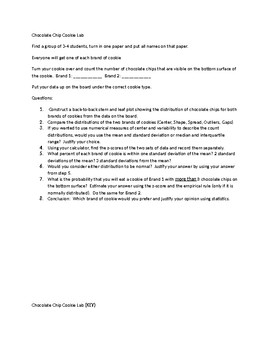
Which Chocolate Chip Cookie Would You Eat?
For Statistics: Lab where kids will make a back-to-back stemplot, analyze it using statistics and conclude with reasoning why they chose the brand they chose. (key terms used: stemplot, center, shape, spread, right skewed, left skewed, symmetric, mean, median, iqr, range, standard deviation, z-score)
Subjects:
Grades:
10th - 12th, Higher Education
Types:
Showing 1-13 of 13 results


