219 results
Free high school statistics worksheets
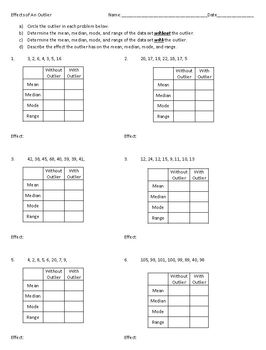
Effects of an Outlier on Mean, Median, Mode, and Range
This worksheet helps reinforce the effect of an outlier on the mean, median, mode, and range of a data set. Six data sets are provided. Students must calculate the mean, median, mode, and range of each data set with the outlier included, then with the outlier excluded. They must then determine what effect the outlier has on these statistics when included in the data set. A complete answer key is also provided.
Subjects:
Grades:
6th - 9th
Types:
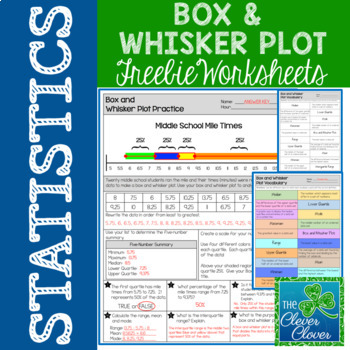
Box and Whisker Plot - FREEBIE
This resource can be used for practice with creating and interpreting box and whisker plots. Students will use twenty mile times in order to calculate the five number summary. Space is provided for students to list the numbers in order from least to greatest. Students are directed to shade and label each quartile of the box and whisker plot. After the plot has been drawn, students can answer six questions pertaining to the data.
Practice with vocabulary is also important. Students can use
Subjects:
Grades:
6th - 9th, Adult Education
Types:
Also included in: Statistics Bundle - Guided Notes, Worksheets & Scavenger Hunts!
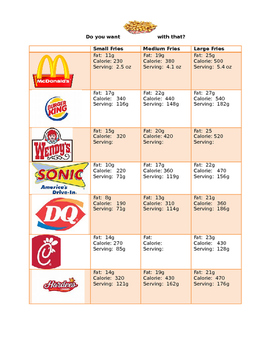
French Fry Scatter Plot & Best Line of Fit
Students will compare the nutritional values and serving sizes of french fries from various fast food restaurants. Based on this information, they will create scatter plots, best lines of fit and the equation of the trend line. Using the equation, they will estimate the unknown values of kid meals and supersized portions of french fries.
Subjects:
Grades:
8th - 11th
Types:
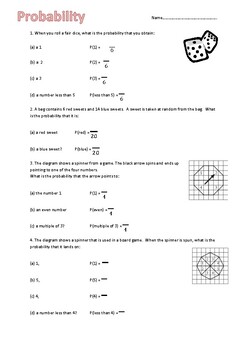
FREEBIE! - Scaffolded basic probability worksheet
This worksheet is perfect for low ability, SEN and struggling students to help support them in finding basic probabilities. The worksheet has fractions included and students have to fill in the missing spaces. A good supporting worksheet for an intro into probability. Answer key included.
Subjects:
Grades:
7th - 9th
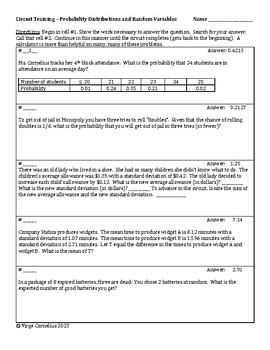
Circuit Training -- Probability Distributions and Random Variables
I wrote this set of 20 exercises to give my students more practice with the "bridge unit" (probability) between the basics of statistics and inference. A calculator is deifnitely required. Students begin in cell #1, work the problem, search for that answer and continue in this manner until the complete the circuit (get back to the beginning). This circuit is challenging! Let me know what you think! virge@virgecornelius.com
Subjects:
Grades:
10th - 12th, Higher Education
Types:
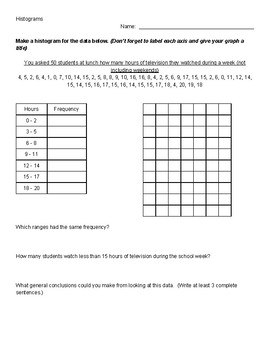
Histograms
Students will practice making histograms and manipulating bin width to see the change in frequency.
Subjects:
Grades:
6th - 9th
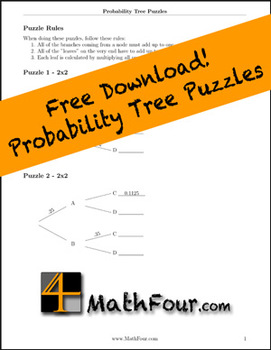
Probability Tree Puzzles
Using probability tree diagrams to teach probability is helpful - but sometimes kids need a little practice with them.
This worksheet has 11 probability tree diagrams to be "worked" as puzzles. This gives students practice filling them in and understanding the dynamics.
Once they have this practice, they can effectively use probability trees diagrams as tools.
Make sure you also download my Probability Trees Explained free "cheat sheet."
Subjects:
Grades:
8th - 12th, Higher Education
Types:
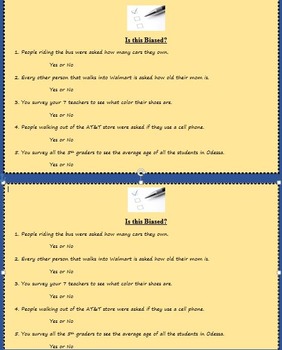
Is this Biased? (populations and random samples)
This is a 5 question quiz, exit ticket, do now, or homework assignment that reviews how surveys and samples can be biased sometimes. All 5 can be answered with a yes or no for whether it is indeed a biased survey. Enjoy and please rate and/or comment on this product!
Subjects:
Grades:
5th - 9th
Types:
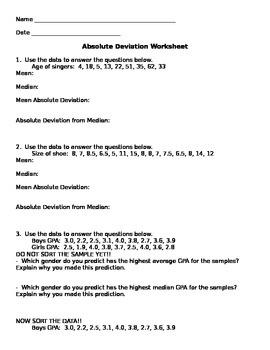
Mean Absolute Deviation Worksheet
Students will practice finding measures of central tendency and then calculate the mean absolute deviation as well as the absolute deviation from the median.
Subjects:
Grades:
6th - 10th
Types:
CCSS:
Statistics: Plots, Shapes of Distributions, Choosing Mean or Median
Statistics Integrated Review: Plots, Shapes of Distributions, and Statistics for Center and SpreadUse common data plots to determine shape of the data distribution, and choose appropriate statistics for center and spread. This product includes a one-page integrated review with a worksheet and answer key aligned with the common core. Students practice identifying the shape of a data distribution using common data plots (dot plot, histogram, and boxplot). Students also review how to choose appropr
Subjects:
Grades:
8th - 12th
Types:
CCSS:
Also included in: Bundle: Algebra 1 Statistics Unit Curriculum (Common Core)
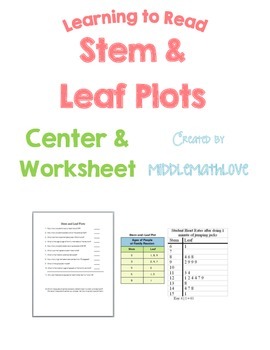
Data Analysis Worksheet - Reading & Analyzing Stem and Leaf Plots
This product is perfect for an introductory or review lesson on understanding how to read stem and leaf plots. Post the data displays on the SmartBoard or print out copies for each student. Students answer questions on the worksheet by reading and analyzing the graphs.
Stem and Leaf Plot Activity Includes:
--1 Stem and Leaf Plot Student Worksheet
--2 slides of Stem and Leaf Plots
I combined this product with my other data analysis worksheets (box and whisker plots and histograms) to create
Subjects:
Grades:
7th - 10th
Types:
Worksheet on Two-Way Tables with Answers
A quick worksheet on two-way tables, including filling one in from given data, finishing a part-completed table and a question which is easiest with a two-way table but without mentioning it. Hope you like it.
Subjects:
Grades:
7th - 11th
Types:
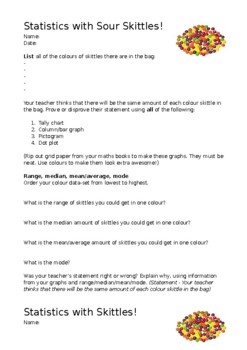
FUN Statistics with M&Ms and Skittles!
FUN Statistics worksheet for skittles, sour skittles, and M&Ms. Kids to work in groups (4-6 students per group works best). Buy one pack of skittles or sour skittles or M&Ms per group. Includes: Mean/average, mode, median, range. Graphs: Tally chart, dot plot, bar/column graph, pictogram. Edit to suit what you have covered in class.
Subjects:
Grades:
5th - 10th
Types:
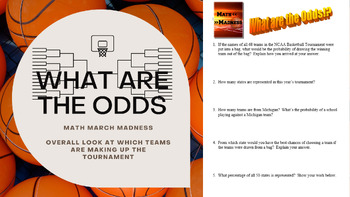
Math March Madness - What are the Odds!? (Overall Stats of Tournament Make Up)
Math + March Madness = Golden Learning Opportunities! Refocus those off topic conversations about march madness that come into the classroom into productive discussions from the math perspective! Students will be excited to work with this authentic, real world math application of probability and statistics. This assignment can be used after tourney teams are announced, but before all the action begins to research stats on teams that will be competing as well as answer a few probability questi
Subjects:
Grades:
6th - 12th, Higher Education
Types:
CCSS:
Interquartile Range (IQR) & Box-and-Whisker Plot Review
This is a half sheet document with four questions to review both interquartile range and box-and-whisker plots. Can be used in an interactive notebook or as an exit ticket.No teacher prep for one page in an interactive notebook! Or you may use it as a quick exit ticket at the end of a class period. Very flexible with how you want to use the four questions. Save paper with the one sheet to two students ratio!Answer key is included for all four problems.I want to improve my products. If you have a
Subjects:
Grades:
6th - 9th
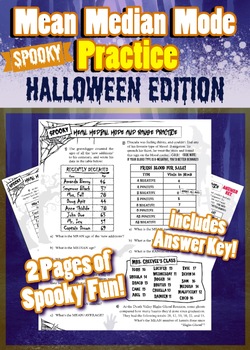
Halloween Mean Median Mode Range Practice - Spooky and Fun Math Handout
Spooky and FUN Mean Median Mode Range Practice - Halloween Printable ActivityEven your most ghoulish students will love this handout! It's full of hilarious scenarios and monster names, and includes lots of spooky fonts and icons. Your students will be so entertained by this printable, that they'll forget they're improving their math skills while using it.Since each problem on the handout is a multi-part problem, this handout features over 25 chances for students to improve their statistical ana
Subjects:
Grades:
4th - 9th, Adult Education
Types:
Probability of chance events using number lines fractions percents
Get students started in probability by helping them understand that probability of chance events can be expressed in terms such as impossible, unlikely, equally likely, likely and certain. CCSS 7.SP.5 - They'll learn that probability can also be described by a number from zero to one. Included are two/ activities/worksheets to help you start your students in their first formal introduction to probablity.
Please rate my work and provide feedback!
Terri Feil
Subjects:
Grades:
5th - 9th
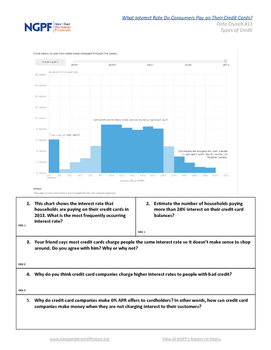
What Interest Rate Do Consumers Pay On Credit Cards?
Using data supplied by National Public Radio (NPR), students can see the wide variation in interest rates that consumers pay on their credit cards. A good discussion starter about the importance of a good credit score and how to think about those 0% APR credit card offers. NGPF Data Crunches (cli.re/ngpf-data-crunch) teach your students key personal finance concepts while also honing their analytical skills.
Subjects:
Grades:
9th - 12th
Types:
Probability - Independent and Dependent Events
This self checking worksheet will have the students pondering the difference between independent events (roll a die and spin a spinner) and dependent events (drawing cards without replacement). When finished, the student will get some sound advice.
Subjects:
Grades:
10th - 11th
Types:

Two-Way Frequency Table Activity
8.SP.4 8th grade Common Core statistics. Students survey fellow classmates and make a two-way frequency table. Questions involving marginal relative frequencies and joint relative frequencies follow.
Subjects:
Grades:
7th - 9th
Types:
CCSS:
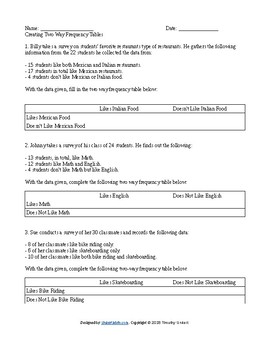
FREE Two-Way Frequency Tables Worksheet! (HSS.CP.A.4)
In this FREE worksheet students tackle 6 problems where they must complete (fill in) empty two-way frequency tables. Can be used as a worksheet, homework, or as an assessment! Answer key included. Aligns with Common Core Standard HSS.CP.A.4. Four pages total including answer key.
Subjects:
Grades:
8th - 10th
Types:
CCSS:
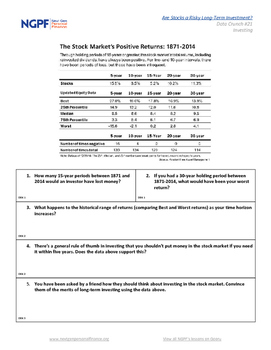
Are Stocks A Risky Long Term Investment?
Using research from WisdomTree Asset Management, students analyze the returns in from the stock market over the long term. NGPF Data Crunches ( cli.re/ngpf-data-crunch ) teach your students key personal finance concepts while also honing their analytical skills.
Grades:
7th - 12th
Types:
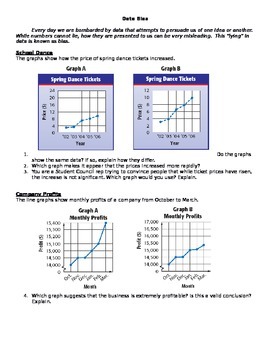
Data Bias
Science/Math lessons teaching students how graph scales and data averages can lead to misleading data. Students practice the following College Readiness Standards with this lesson:
- IOD 202 Identify basic features of a table, graph, or diagram (e.g., units of measurement)
- IOD 304 Determine how the values of variables change as the value of another variable changes in a simple data presentation
- IOD 402 Compare or combine data from a simple data presentation (e.g., order or sum data from a t
Subjects:
Grades:
9th - 12th
Types:
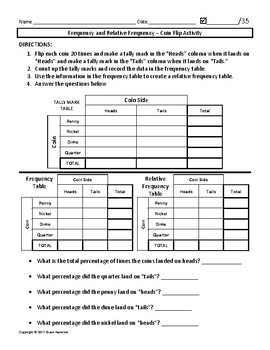
Frequency and Relative Frequency Coin Flip Activity
This is a great class activity to reinforce frequency and relative frequency tables.
*I copy this assignment front/back.
1. Divide the class into pairs. *I prefer pairs in this activity because one person flips and the other writes down the data. This way, no one is just sitting there :).
2. Pass out the worksheet and a bag with a penny, nickle, dime, and a quarter. I remind students that I am going to be wanting that money back..haha.
3. I go through the instructions and explain that they wi
Subjects:
Grades:
8th - 9th
Types:
Showing 1-24 of 219 results


