11 results
Free high school statistics homeschool curricula

Probability of chance events using number lines fractions percents
Get students started in probability by helping them understand that probability of chance events can be expressed in terms such as impossible, unlikely, equally likely, likely and certain. CCSS 7.SP.5 - They'll learn that probability can also be described by a number from zero to one. Included are two/ activities/worksheets to help you start your students in their first formal introduction to probablity.
Please rate my work and provide feedback!
Terri Feil
Subjects:
Grades:
5th - 9th
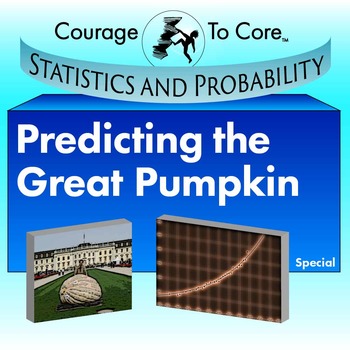
Predicting the Great Pumpkin: 8.SP.A.1...
Students will speculate on the world records for weights of pumpkins. They will graph the data for the records and find the line of best fit. They will either use a graphing calculator or given graphs and functions to explore quadratic and exponential regressions. They will make a short-term prediction about the world record in 2015. This mission is aligned with Common Core Standards: 8.SP.A.1, 8.SP.A.2, 8.SP.A.3.
The fun stuff:
2323 pounds. That’s the weight of a world record for the heaviest
Subjects:
Grades:
7th - 11th
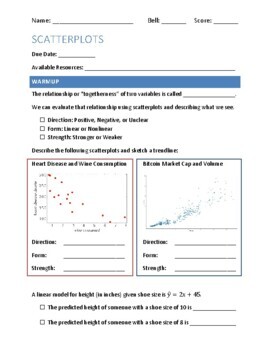
Scatterplots: Activity and Fat/Protein Application
Classroom and homework activity for Algebra 1 or 2 for after a lesson on correlations and scatterplots.Overview of interpreting and creating scatterplots and trendlines.Students create their own scatterplot of fat and protein in food, make predictions, and use a trendline with an online NCTM tool.Includes post-lesson reflection.Positive/Negative, Linear/Nonlinear, Weak/Strong correlations.Line of best fit.NO use of R (correlation coefficient).
Subjects:
Grades:
9th - 11th
Project-Based Learning | High School Math (Statistics) | Data Collection, Graphs
Chugging Along or Running Late? A Project-Based Learning Bonanza for Aspiring Statisticians and Transportation Engineers!Are you an educator, homeschool parent, or student looking for an engaging Project-Based Learning (PBL) experience that goes beyond theory and tackles a real-world challenge in the transportation industry? Look no further than Scienovate's Chugging Along or Running Late? Analyzing Delays in Commuter Rail Systems project!A Winning Project for Every Learner:This meticulously des
Subjects:
Grades:
9th - 12th, Higher Education, Adult Education
Also included in: Project-Based Learning, PBL | High School Math (Statistics)
Project-Based Learning | High School Math (AP Statistics), AP Statistics Project
Green vs. Concrete: Equipping Future Leaders with AP Statistics for Sustainable DesignThe construction industry faces a critical challenge: balancing the growing need for housing with the importance of preserving green spaces. This is where Scienovate's innovative Green vs. Concrete: Can Statistics Help Us Achieve Sustainable Neighborhood Design? Project-Based Learning Project (PBL) comes in.A Project-Based Learning Powerhouse:This meticulously crafted AP Statistics project transcends the realm
Subjects:
Grades:
9th - 12th, Higher Education, Adult Education
Also included in: Project-Based Learning, PBL | High School Math (AP Statistics)

Comprehensive Statistics Worksheet Collection - 8 Units - 34 Worksheets
Enhance your statistics curriculum with this extensive collection of 34 worksheets spanning 8 units. Whether you're a math teacher looking for additional resources or a homeschooling parent seeking comprehensive materials, this worksheet collection provides a wealth of content to support students' understanding of statistics.Unit 1: Introduction to StatisticsWorksheets: 4Description: Introduce students to the fundamentals of statistics, including descriptive vs. inferential statistics, types of
Subjects:
Grades:
9th - 12th, Higher Education, Adult Education
5:23
Statistics: The Normal Distribution (Introduction)
This is a crash course on the normal distribution and z scores. When I was taking statistics for the first time, I just couldn't wrap my head around this concept. I wish someone had explained it to me like this.....
If you'd like to assign this video to your students to watch at home, please use the following link:
Statistics: The Normal Distribution (Intro) YOU TUBE
**Follow me on FB and Pinterest for math trivia, jokes, and other resources. Keepin' Math Fun!
Kaffenate Math on FB
Kaffena
Subjects:
Grades:
10th - 12th, Higher Education
6:21
Statistics: The Normal Distribution Part 2 (Z-scores)
What's a z score and WHAT do I do with it? Watch and learn....
If you'd like to assign this video to your students to watch at home, please use the following link:
Statistics: The Normal Distribution PART TWO--YOU TUBE
**Follow me on FB and Pinterest for math trivia, jokes, and other resources. Keepin' Math Fun!
Kaffenate Math on FB
Kaffenate Math on Pinterest
**10% of all Kaffenate Math proceeds go to
Thor and Athena's Promise Sanctuary Horse Rescue
Subjects:
Grades:
10th - 12th, Higher Education
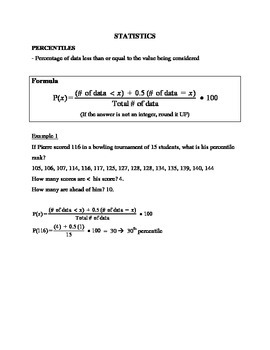
Sec 4 Stats Notes with Explanation and Examples
Topics covered:
Percentile
Contingency Table
Scatter Plot
Correlation Coefficient
Regression Line
Subjects:
Grades:
10th
Concept Summary Using the 1.5XIQR Rule for Outliers
This is a brief description of the concept of using the 1.5XIQR rule for outliers.
Subjects:
Grades:
9th - 12th, Higher Education
Machine Learning: Interdisciplinary Curriculum Content
As an Introduction to Machine Learning Concepts, students read the following texts to prompt critical thinking, communication, collaboration and creativity.
Subjects:
Grades:
6th - 9th
Showing 1-11 of 11 results


