33 results
Free high school statistics interactive notebooks
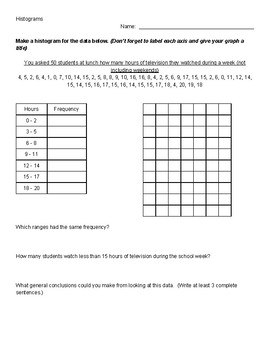
Histograms
Students will practice making histograms and manipulating bin width to see the change in frequency.
Subjects:
Grades:
6th - 9th
Probability Addition Rules Guided Notes (Mutually Exclusive and Overlapping)
Probability Addition Rules Guided Notes
This set of guided notes focuses on finding the probability mutually exclusive and overlapping events. All of the problems feature the key word "OR." For example, students might have to find the probability of choosing an ace or a spade from a standard deck of cards.
These fill in the blank notes include 3 examples and 5 practice problems. I have included the full size notes as well as the notes printed 2 to a page, which fits well in a spiral notebook
Subjects:
Grades:
6th - 12th
CCSS:
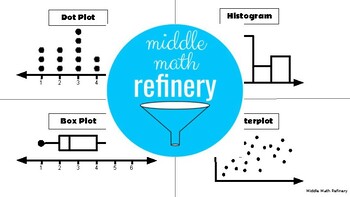
Printable: Types of Graphs (Dot Plot, Histogram, Box Plot, Scatterplot)
This easy-to-use resource features the four (4) types of graphs students learn about in middle school math and high school statistics: dot plots, histograms, box (or box and whiskers) plots and scatterplots. Great to use for scaffolded notes or on your word wall!Features:One (1) blank/ fillable page with missing names of graphsAnswer key with labels
Subjects:
Grades:
6th - 10th
CCSS:
Interquartile Range (IQR) & Box-and-Whisker Plot Review
This is a half sheet document with four questions to review both interquartile range and box-and-whisker plots. Can be used in an interactive notebook or as an exit ticket.No teacher prep for one page in an interactive notebook! Or you may use it as a quick exit ticket at the end of a class period. Very flexible with how you want to use the four questions. Save paper with the one sheet to two students ratio!Answer key is included for all four problems.I want to improve my products. If you have a
Subjects:
Grades:
6th - 9th
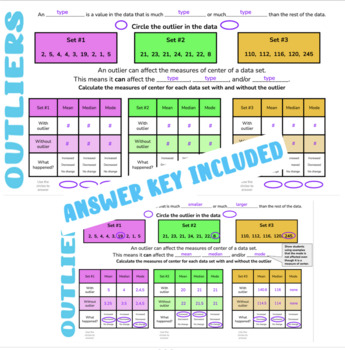
Outliers Google Slides
Try out an activity on me! Students learn how to identify an outlier is in a data set and what it does to the measures of center (mean, median, mode (shows no effect on mode). Includes guided notes and practice problems where students identify measures of center of data with and with and without the outlier. Would make a great introduction or review in any math classroom! Would make a great addition to a digital interactive notebook! Answer key included. Digital learning friendly!
Subjects:
Grades:
6th - 10th
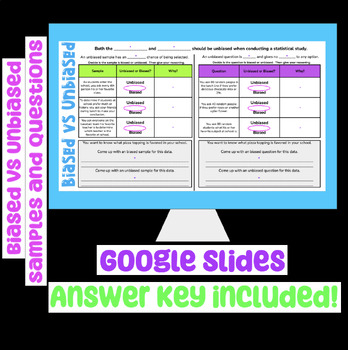
Biased vs Unbiased Samples and Questions Google Slides Digital Notes
Try out an activity for free!Students learn how to identify if a statistical sample and/or question is biased or unbiased. Includes guided notes and practice identifying biased and unbiased samples and questions. Would make a great introduction or review in any math classroom! Would make a great addition to a digital interactive notebook! Answer key included. Digital learning friendly!
Subjects:
Grades:
6th - 9th
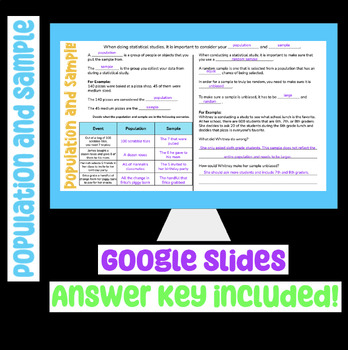
Population and Sample Google Slides Digital Notes
Try out an activity for free!Students learn how to identify the sample and population of a statistical study. Includes guided notes and practice problems where students identify the population and sample, and then use the sample to predict the outcome of the population. Would make a great introduction or review in any math classroom! Would make a great addition to a digital interactive notebook! Answer key included. Digital learning friendly!
Subjects:
Grades:
6th - 9th
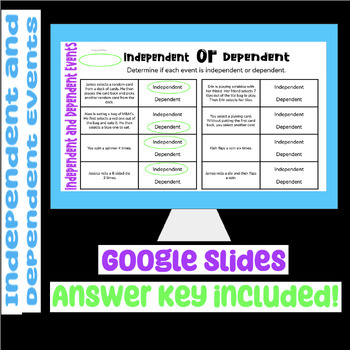
Independent and Dependent Events Google Slides Digital Notes
Try out an activity for free!Students learn how to identify independent and dependent events. Includes guided notes and practice problems where students identify if events are independent or dependent. Would make a great introduction or review in any math classroom! Would make a great addition to a digital interactive notebook! Answer key included. Digital learning friendly!
Subjects:
Grades:
6th - 9th
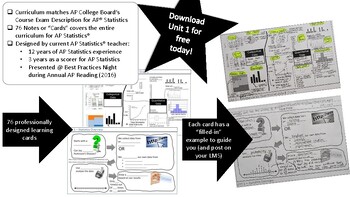
AP Statistics Learning Cards - Unit 1
AP Statistics' Learning Cards for Unit 1 are professionally designed fill-in-the-blank cards that match the AP Statistics Course Description6 cards in unit 1Word documents provide 2 different formats to present to studentsPowerPoint presentation fileAll documents are editable
Subjects:
Grades:
9th - 12th

Histograms on the TI-84 Graphing Calculator Reference Sheet Freebie
FREEBIE Statistics Creating Histograms on the TI 83 84 PlusThis easy to follow handout helps your students learn to use the TI 83 - 84 Plus Graphing Calculator to enter data into lists and create histograms from a list of data, and to customize them. Great for Algebra, Statistics, AP, Regular and Dual Enrollment, and for the SAT. There are two versions, one for the TI 83 Plus and the second supports for newer OS of the TI 84 Plus.These can be used as Binder Notes or printed two to a page for
Subjects:
Grades:
9th - 11th
CCSS:
Probability Notes
Great notes to introduce probability!
These notes cover the concepts:
-Probability
-Theoretical Probability
-Experimental Probability
-Probability Trees
Spinner's are provided if you choose to use them for your experimental probability. Just copy in color onto cardstock and cut out. Use a pencil and a paperclip as the spinner.
Enjoy!
Subjects:
Grades:
6th - 10th
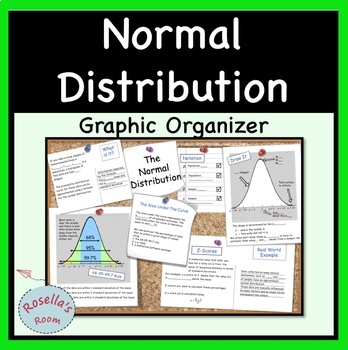
Normal Distribution Graphic Organizer
This graphic organizer summarizes:- properties of the normal distribution- the 68-95-99.7 rule- z-scoresIncluded are three scaffolded versions of the same graphic organizer; two are designed for students to fill in (one is left blank and the other has missing text) and the third is complete with all text. Great for revision.
Subjects:
Grades:
9th - 12th, Higher Education, Adult Education

Statistics: Counting the Community Biblical Integration Lesson
Making authentic connections between Scripture and Math can be challenging. Biblical integration is not just displaying a Bible verse or reading from a devotional, but rather it is demonstrating the correlations between our subject matter and God's perfect design. Hopefully, these lessons will inspire amazing conversations and serve you and your students well.In This Lesson:Students will explore how statistics played a role in biblical times through the example of the census of Israel and discus
Subjects:
Grades:
9th - 12th
Types:
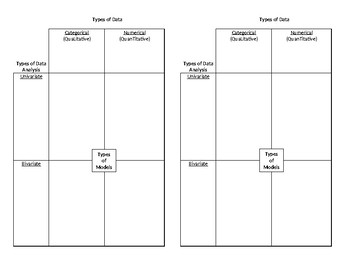
Intro to Data Analysis Graphic Organizer
I created this template for an introduction to my data analysis unit in Algebra I. We discuss and define categorical vs. numerical data, univariate vs. bivariate analysis, and the different graphs or models that apply to each. Since we use Interactive Notebooks, it is designed to be half a page.
Subjects:
Grades:
7th - 12th
CCSS:
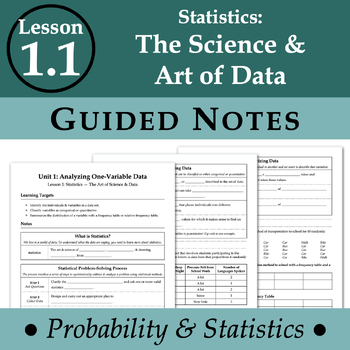
Statistics: The Science & Art of Data (ProbStat - Lesson 1.1)
Statistics: The Science & Art of Data GUIDED NOTESThis is lesson 1 in Unit 1 Analyzing One-Variable Data.What is included?Guided NotesExamplesCumulative "Check Your Understanding" PracticeTyped KeyLesson ObjectivesIdentify the individuals & variables in a data set.Classify variables as categorical or quantitative.Summarize the distribution of a variable with a frequency table or relative frequency table.
Subjects:
Grades:
9th - 12th
Also included in: Unit 1 Analyzing One-Variable Data NOTES BUNDLE (ProbStat)
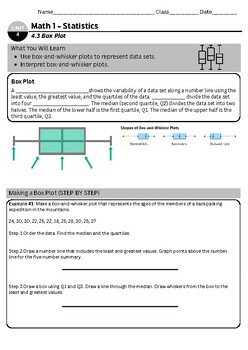
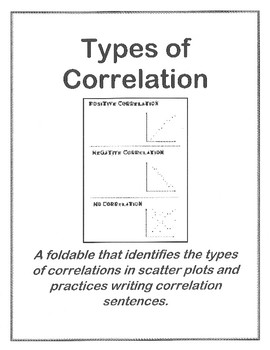
Scatter plots and Correlation foldable
Use this foldable in an interactive notebook (SIN). I use this in Algebra One to review scatter plots and correlation (also called association). Students also practice identifying what type of correlation various scenarios represent and writing correlation sentences for those scenarios. My students LOVE their interactive notebooks. And for algebra one, the ISNs we create are an invaluable resource for students throughout all their high school math experiences.
Subjects:
Grades:
8th - 10th
Types:
AP Statistics. Geometric Distributions (with video of lesson)
This product contains lesson 28 of the AP Statistics Curriculum and the second lesson in Unit 4 (follows College Boards® new format).If you are interested in purchasing the whole curriculum, visit my store. I sell the whole curriculum with videos of the lessons and without videos. Included in this download:-Guided Notes-Lesson Key-SMART notebook file of the guided notes to fill in with students-Assignment (Homework/Classwork)-Lesson Quiz-Video of lessonThese lessons are also sold without a video
Subjects:
Grades:
9th - 12th
Also included in: AP Statistics Curriculum Mega Bundle (with videos of each lesson)
Statistics Bundle Supplementary Materials and CCSS Alignment Guide
This product contains three components: a CCSS Alignment Guide (to determine which standards are addressed in each unit of our Statistics Bundle), a "How to Use" guide, and a detailed Table of Contents for each unit in our Statistics Interactive Notebook Bundle.These supplementary materials can help you determine if the Statistics Bundle is a good purchase for you. If you have already purchased our materials, these products will provide additional organization tools to help you plan and prepare.
Subjects:
Grades:
9th - 12th
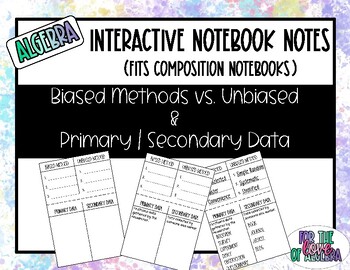
Biased vs. Unbiased Sampling Methods and Primary / Secondary Data NOTES
Simple notes on whether the 6 sampling methods are considered to be biased or not. The second half is on examples of primary and secondary data. A sample answer key is included.
Subjects:
Grades:
9th - 12th
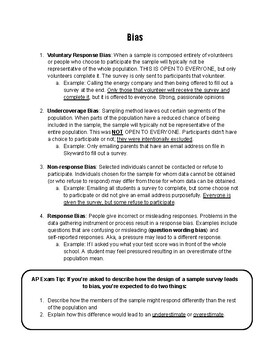
Types of Bias
These are notes for AP Statistics Unit 3: Bias. There are definitions listed as well as examples and helpful hints.
Subjects:
Grades:
9th - 12th
Random Sample Introduction and Vocabulary Notes Handout + Distance Learning
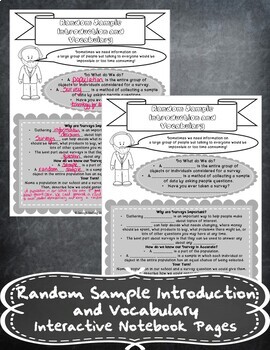
Random Sample Introduction and Vocabulary Notes HandoutTHIS FILE NOW CONTAINS THE PDF VERSION OF THIS PRODUCT PLUS A GOOGLE SLIDES VERSION FOR DISTANCE LEARNINGTHIS PRODUCT IS NOW INCLUDED IN Statistics with Univariate Data - Unit 2 - 8th Grade-Notes + Distance Learning Bundle!This handout covers:- Random Sample Vocabulary- Uses of Random Samples- Real-World Random SamplesThis product includes:- Pictures of the finished foldable in my INB- Link to mp4 Video Notes- Embedded Video Notes in Google
Subjects:
Grades:
7th - 9th
AP Statistics-Introduction to Significance Tests (Lesson only)
Students will: -Identify the null and alternative hypotheses for a significance test about a population -Interpret a P-value in the context of the problem -Make an appropriate conclusion based on a significance level -Determine if results are statistically significant -Describe Type I and Type II errors along with giving the consequences of each of the errors.My lessons are guided notes with keys. Full lessons come with homework/classwork and SMART notebook file
Subjects:
Grades:
9th - 12th
Showing 1-24 of 33 results


