36 results
Free high school statistics centers
Teaching Probability and Risk with SKUNK
Teaching Probability and Risk with SKUNK
SKUNK is a classroom classic – it involves risk, reward, and math that teaches concepts like probability and chance. On top of the intrinsic reward of winning, and the excitement of chance, SKUNK is an incredibly low-prep game that requires no more than paper and dice!
Teaching the Game of SKUNK....
Common Core Standards:
This activity and a lesson plan explaining it meets common core standards for Statistics and Probability. This lesson works best f
Subjects:
Grades:
4th - 9th
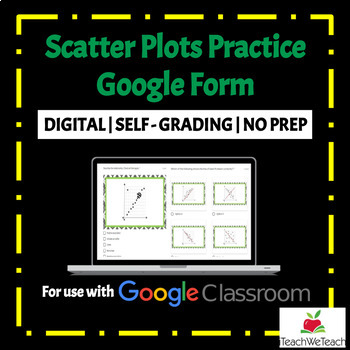
Scatter Plots | Google Forms Activity
★ DIGITAL Math Resource★ Are you looking for quality, standards aligned math resources to use with Google Classroom™? This resource is a fun and engaging way for students for practice solving problems involving scatter plots. This product includes a Google Form with 20 questions about scatter plots. Problems cover correlation type, the line of best fit and predicting scatter plot values. Possible Uses:• Practice• Homework • Assessment• ReteachCheck out my other products HERE.Please review my ter
Subjects:
Grades:
7th - 12th
Types:
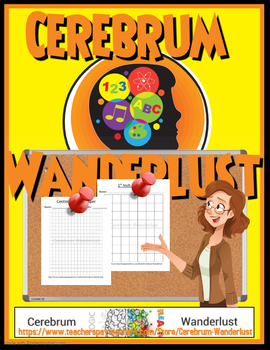
Centimeter & 1 Inch Grid Papers (Full Sheets Each)
A full sheet of Centimeter Grid Paper and a full sheet of 1 inch Grid Paper all contained in one easy to transport/store .pdf. You can use these sheets with making charts, plotting points, etc... Enjoy and thank you for your support.
Subjects:
Grades:
PreK - 12th, Higher Education, Adult Education, Staff
Types:
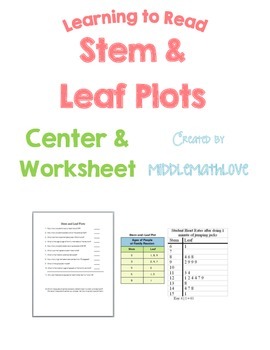
Data Analysis Worksheet - Reading & Analyzing Stem and Leaf Plots
This product is perfect for an introductory or review lesson on understanding how to read stem and leaf plots. Post the data displays on the SmartBoard or print out copies for each student. Students answer questions on the worksheet by reading and analyzing the graphs.
Stem and Leaf Plot Activity Includes:
--1 Stem and Leaf Plot Student Worksheet
--2 slides of Stem and Leaf Plots
I combined this product with my other data analysis worksheets (box and whisker plots and histograms) to create
Subjects:
Grades:
7th - 10th
Types:
Measures of Center - Math Mural (FREEBIE)
Measures of Center - Math MuralAligned with Texas TEKS 6.12(C)In this activity, students solve 9 problems to practice finding the mean, median, mode and range and get their work approved by the teacher. Then they cut out mural pieces and match their answers to the problem numbers to create their Math Mural picture!This product includes:Page 1- Title PagePage 2- 9 Measures of Center Problems with Work SpacePage 3- Math Mural CanvasPage 4- Math Mural PicturePage 5- Answer KeyWorks great as:- Cente
Subjects:
Grades:
6th - 9th
Types:
CCSS:
Probability Basics
This resource is a free small notebook for teaching the basics of the probabilities for high school and colleges. The resource is a PDF of nine pages and contains 11 different subjects supported by figures and solved examples. The subjects are:Random Experiment.Sample Space.Event.Deck of Cards.Probability.Operations on Events.Mutually Exclusive Events.Conditional Probability.Independent and Dependent Events.Combinatorics.Tree Diagram.If required, I am entirely ready to prepare a low price comple
Subjects:
Grades:
11th - 12th, Higher Education, Adult Education, Staff
Types:
Probability of chance events using number lines fractions percents
Get students started in probability by helping them understand that probability of chance events can be expressed in terms such as impossible, unlikely, equally likely, likely and certain. CCSS 7.SP.5 - They'll learn that probability can also be described by a number from zero to one. Included are two/ activities/worksheets to help you start your students in their first formal introduction to probablity.
Please rate my work and provide feedback!
Terri Feil
Subjects:
Grades:
5th - 9th
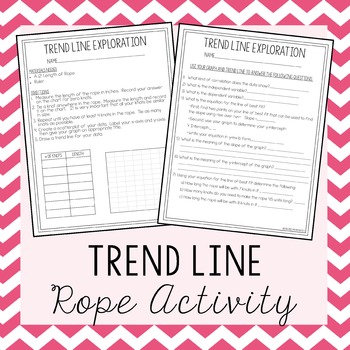
Trend Line Activity ~ Knots in a Rope
***This activity requires each student to have a 12" length of rope and a ruler***
Students collect data by tying knots in a rope and recording the length of the rope after each knot. Students then use this data to do the following:
~Create a Scatterplot
~Draw a Trend Line
~Write an equation in slope-intercept form for the trend line
~Use the equation of their trend line to make predictions
o Click Here for more Functions & Linear Equations activities
o Click Here for more 8th Grade Math
Subjects:
Grades:
6th - 9th
Types:
Also included in: 8th Grade Math Bundle ~ All My 8th Grade Math Products at 1 Low Price
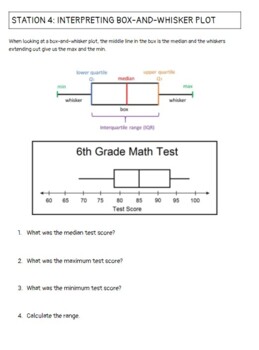
Applied Statistics End of Year Review Stations
A set of 10 stations to help students practice interpreting bar graphs, stem-and-leaf plots, and box-and-whisker plots. Also, works with finding the mean, median, mode, and range. Finally, have probability and normal distribution questions.
Subjects:
Grades:
7th - 12th
Types:
CCSS:

Two-Way Frequency Table Activity
8.SP.4 8th grade Common Core statistics. Students survey fellow classmates and make a two-way frequency table. Questions involving marginal relative frequencies and joint relative frequencies follow.
Subjects:
Grades:
7th - 9th
Types:
CCSS:
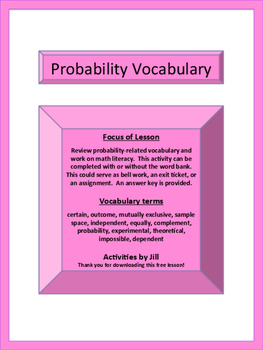
Probability Terms Worksheet with Word Bank (Distance Learning)
Focus of LessonReview probability-related vocabulary and work on math literacy. This activity can be completed with or without the word bank. This could serve as bell work, an exit ticket, a math center, or an assignment.Vocabulary termscertain, outcome, mutually exclusive, sample space, independent, equally, complement, probability, experimental, theoretical, impossible, dependentUse this note-taking product to introduce the vocabulary terms!Probability Vocabulary NotesCCSS 7.SPProbability Te
Subjects:
Grades:
6th - 9th
Types:
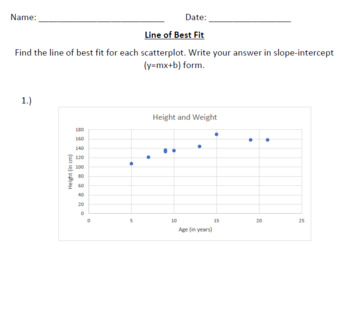
Line of Best Fit Practice
Every practice I have seen for line of best fit asks students to create the scatter plot and then find the line of best fit. However, this takes significantly longer. I created these scatter plots to give students a chance to focus specifically on creating a line of best fit and finding the slope-intercept equation of the line. I have attached the PDF and Word version (for editing), as well as an answer key. Please keep in mind that answer may differ depending on which points are chosen to calcu
Subjects:
Grades:
7th - 9th
Types:
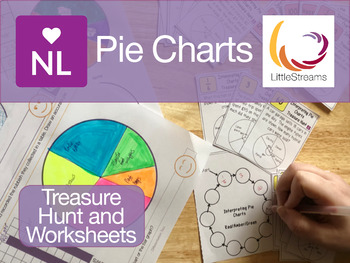
Pie Charts Drawing & Interpreting (Worksheets and Scavenger Hunt)
#freebiefridayThis free download is brought to you in collaboration with LittleStreams and it combines two fully differentiated resources covering drawing, reading and interpretation of pie charts. The first is a pack of six worksheets by LittleStreams the first four are of increasing difficulty drawing pie charts from tables and another two worksheets of increasingly difficulty drawing pie charts from bar charts. Solutions are provided for each worksheet. The second pack in this free download
Subjects:
Grades:
5th - 9th
Types:
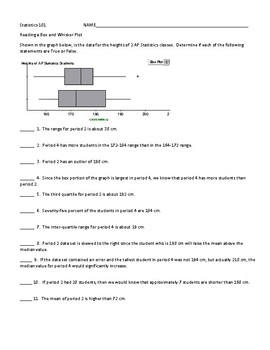
Box and Whisker Plots--11 True False Questions
Compare side by side box and whisker plots by answering 11 True/False questions.
Subjects:
Grades:
9th - 12th, Higher Education
Types:
CCSS:

Measures of Central Tendency PowerPoint
Here lies a PowerPoint for a quick review of how to choose the most beneficial measure of central tendency and how to calculate a "wanted" or "missing" piece of data when using mean. This makes a good math center, bellwork, or whole class discussion. Sometimes I use it to pre-test; sometimes for a post-test. ENJOY!
Subjects:
Grades:
7th - 9th
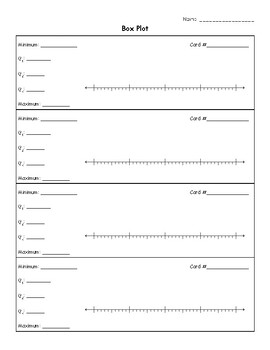
Creating box and whisker plots Card Activity
This low-prep set includes 16 cards that are perfect for practice. With minimal prep required, your students will practice and build these skills in a fun, engaging and out-of-their seat activity perfect for supplementing any lesson. 16 Cards 1 recording sheets Answer KeyYour students will love reinforcing their knowledge of box and whisker plots while they are out of their seats and having fun. They will be moving around and you will be keeping math fun! No additional materials are needed, bu
Subjects:
Grades:
6th - 9th
Types:
CCSS:
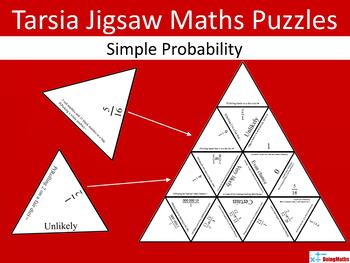
Simple Probability Tarsia Puzzle - Mathematics
A Tarsia match-up jigsaw puzzle on simple probability in both fraction and word form. Included are questions on the probabilities related to dice, playing cards, picking coloured marbles from bags and even the probability of winning the jackpot on the National Lottery. Students need to answer the probability questions correctly in order to match the pieces together and complete the puzzle.Perfect for a lesson starter or agroup activity to check learners' progress.Files are in PDF format and answ
Subjects:
Grades:
6th - 9th
Types:
CCSS:
Also included in: Maths Tarsia Jigsaw Puzzles Mega Bundle - Lesson Starter Activities
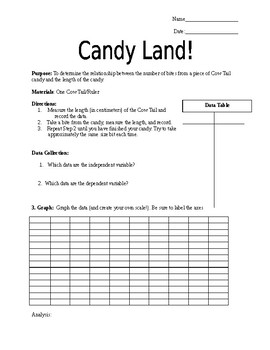
Scatterplots, Correlation and the Bite/Length of a Candy
This is a lesson to show the scatterplot/correlation between the length of a candy bar and the bite number (ie, students measure a candy bar, take a bite, remeasure, etc). Skills used include: interpreting scatterplots, finding a line of best fit and slope, and understanding slope and y-intercept in a real world situation.

2015 March Madness Basketball Stats Stations
These eight stations include percent and measures of central tendency. All questions use stats from the 2015 NCAA basketball tournament. I set a classroom timer and gave students 3 minutes per station. My Algebra class needed the 3 minutes, my honors class needed 2:30, so alter as needed. This is a great review of concepts, especially useful in March and before Spring Break! :)
ANSWER KEY INCLUDED! :)
Enjoy & please leave feedback!
Follow me on Pinterest at: Active Algebra on Pinterest
J
Subjects:
Grades:
6th - 9th
Types:
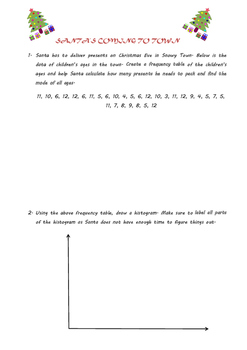
Christmas Statistics Worksheet
A Christmas-themed Statistics worksheet which covers topics on Frequency Tables and Histograms.
Subjects:
Grades:
6th - 9th
Types:
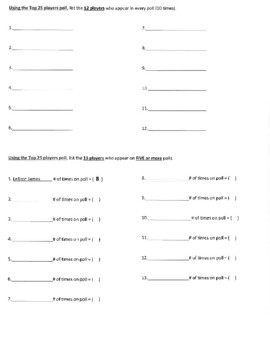
Data Analysis using All-Time NBA Statistics.
According to a new report released by the Education Development Center, Oceans of Data Institute, "the skills necessary for the data analytics jobs of tomorrow aren't being taught in K–12 schools today," said Frank Smith in an article on EdTechMagazine.com.Students will be provided with lists of the All-Time NBA stats leaders from the following categories:1. Points2. Rebounds3. Assists4. Steals5. Blocks6. 3 PT Shots7. Seasons/Games Played8. Most ChampionshipsStudents will also be provided with t
Subjects:
Grades:
4th - 12th

Factorials
Factorial worksheets are a necessity in your pre-algebra or statistics classroom. If you need a quick factorial assessment worksheet in student friendly language, this is your download.
If you would like a super presentation with a load of questions for students, then check out my Help with Factorials, Combinations and Permutations.
For a great bundle, head over to Pre-Algebra Bundle.
Subjects:
Grades:
7th - 9th, Adult Education
Types:
Also included in: 8th Grade Math Bundle-PSSA Testing Ready
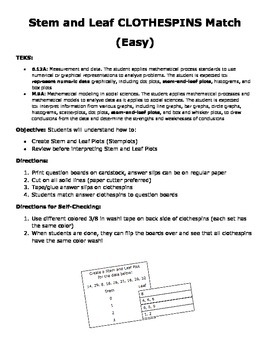
Stem and Leaf CLOTHESPINS Match
Having students practice making stem and leaf plots? Starting with 2-digit data? Reviewing stemplots in Math Models or Statistics before interpreting them?
Have 5-15 minutes?
THEN THIS ACTIVITY IS FOR YOU!
Let your kids have fun with a self-correcting clothespin activity.
TEKS: 6.12A
NEED HELP understanding this game? I made a QUICK blogpost here
Subjects:
Grades:
6th - 12th
Types:
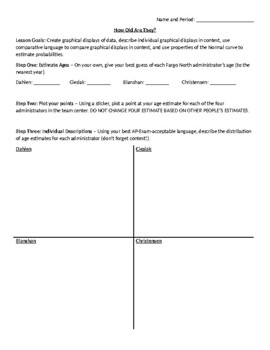
How Old Are Your Principals? Describing and Comparing Quantitative Data Displays
In this activity, students will estimate the ages of their building administrators. Then, they will plot their estimates on a dotplot. From there, they will individually describe the distributions, then go on to compare distributions.This is a great activity for Statistics units in core math courses all the way up to AP Statistics. I use this activity as a resource while reviewing my students for the AP Exam. Worksheet is included as a Word file so that you can edit the names of your administrat
Subjects:
Grades:
6th - 12th, Higher Education
Types:
Showing 1-24 of 36 results


