128 results
Free high school statistics printables
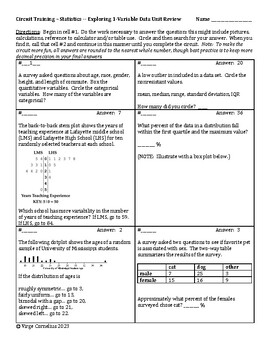
Circuit Training -- Statistics -- Exploring One-Variable Data
I wrote this circuit to help students review for a test on exploring 1-variable data. The topics closely align with Unit 1 from the Advanced Placement Statistics Course and Exam Description. Please read the directions carefully and work the circuit in advance of your students.Directions: Begin in cell #1. Do the work necessary to answer the question; this might include pictures, calculations, reference to calculator and/or table use. Circle and then search for your answer. When you find it, c
Subjects:
Grades:
10th - 12th, Higher Education
Types:
March Madness - Box Plots Freebie
Thank you for checking out this fabulous March Madness Box Plot FREEBIE! Have you been looking for engaging and fun ways to teach your statistics and probability unit. Look no further than this box plots freebie. Be sure to check out the FULL SIZE product below!Click Here to Follow Me and Learn about New Products!All new products are 50% off for the first 24 hours!This document has a March Madness Basketball themed box plot printable... but it also includes a link to the full size product!If you
Subjects:
Grades:
5th - 9th
Types:
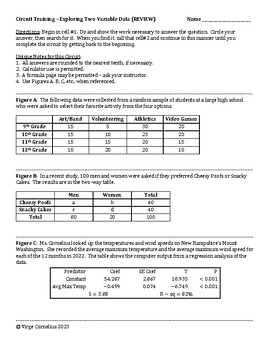
Circuit Training - Statistics - Exploring Two-Variable Data
I wrote this circuit as a review for the end of Unit 2 of the AP Statistics curriculum. It involves mainly linear regression but also some two-way tables. If you have never used a circuit before, I encourage you to read the directions carefully and work the entire set of exercises, in order, ahead of your students. The answers are imbedded in the circuit; it is how students will move from one question to the next. I am pretty sure there are no mistakes, but if you suspect an error, please em
Subjects:
Grades:
11th - 12th, Higher Education
Types:
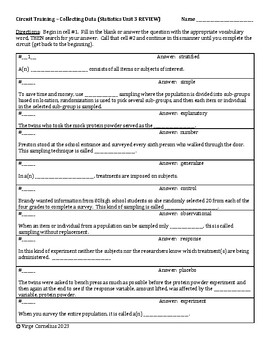
Circuit Training -- Collecting Data (REVIEW Unit 3 Statistics)
Statistics is heavy on vocabulary -- so this circuit helps students review those important words and phrases such as response bias, explanatory variable, randomization, matched pairs design and so much more. Download it, work it out before your students, and decide when it will be best to use to help them review vocabulary at the end of the unit on collecting data and experimental design.Would love your feedback!
Subjects:
Grades:
10th - 12th, Higher Education
Types:
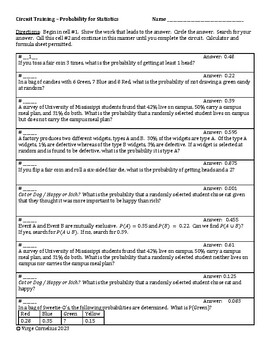
Circuit Training -- Probability for Statistics (Statistics)
I wrote this 20-question circuit to give students practice with the probability needed in statistics. The problems included are closely tied to the first half of AP Statistics Unit 4. A calculator is needed and students may use a formula sheet (or not) of their teacher's choosing. The answer key is not included because the answers are embedded in the circuit; it is how one moves from problem to problem in a scavenger-hunt fashion. Please do not post the answer key (if you make one) online wh
Subjects:
Grades:
10th - 12th, Higher Education
Types:
Centimeter & 1 Inch Grid Papers (Full Sheets Each)
A full sheet of Centimeter Grid Paper and a full sheet of 1 inch Grid Paper all contained in one easy to transport/store .pdf. You can use these sheets with making charts, plotting points, etc... Enjoy and thank you for your support.
Subjects:
Grades:
PreK - 12th, Higher Education, Adult Education, Staff
Types:
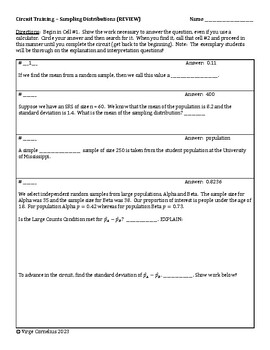
Circuit Training -- Sampling Distributions (Statistics)
Another Stats circuit! In this circuit, students will work with both proportions and means in preparation for inference (but no inference yet). This circuit hit on a lot of the topics from the AP Statistics CED Unit 5. 10% Condition, Central Limit Theorem, Large Counts Condition. Teachers should download the circuit and work it for themselves ahead of the students. The answers are embedded; it is how one moves to the next question in a self-checking, scavenger-hunt manner. If you do everyt
Subjects:
Grades:
11th - 12th, Higher Education
Types:
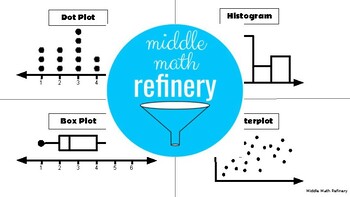
Printable: Types of Graphs (Dot Plot, Histogram, Box Plot, Scatterplot)
This easy-to-use resource features the four (4) types of graphs students learn about in middle school math and high school statistics: dot plots, histograms, box (or box and whiskers) plots and scatterplots. Great to use for scaffolded notes or on your word wall!Features:One (1) blank/ fillable page with missing names of graphsAnswer key with labels
Subjects:
Grades:
6th - 10th
CCSS:
Worksheet on Two-Way Tables with Answers
A quick worksheet on two-way tables, including filling one in from given data, finishing a part-completed table and a question which is easiest with a two-way table but without mentioning it. Hope you like it.
Subjects:
Grades:
7th - 11th
Types:

Printable Box-and-Whisker Plot 2012 Top Movies Fun Algebra Activity
This Printable lists the 15 top grossing movies of 2012. Students are to create a Box-and-Whisker plot or boxplot of the data. Hopefully they will enjoy reminiscing about movies they have seen in the past. Since there are 15 movies, the data is very easy to work with and no averages are needed. To make the problem more complicated, just eliminate one of the movies. There is an answer key provided for the 15 movies. I hope your students have fun!
Thank you for purchasing my product. Please
Subjects:
Grades:
5th - 11th
Types:
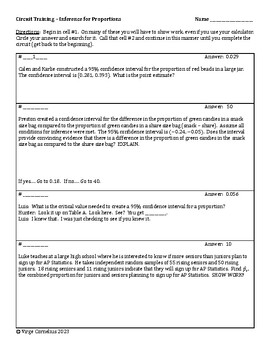
Circuit Training - Inference for Proportions (Statistics)
This 16-question circuit will give your students practice with confidence intervals and significance testing for proportions. The circuit format is self-checking so students know when they have made an error (can't find their answer and/or finish the circuit early). You will love the sound of your classroom when students are working on a circuit! On one of the questions students are asked to conduct a significance test and they will need seperate paper to do a good job on that!If I made edits
Subjects:
Grades:
11th - 12th, Higher Education
Types:
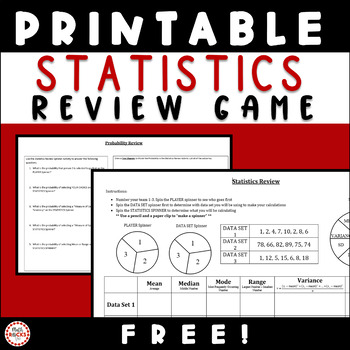
Statistics Review Activity FREEBIE| Mean Median Mode Variance Standard Deviation
Here is a fun way for your students to practice making statistical analysis calculations including mean, median, mode, variance, and standard deviation. INSTRUCTIONS:Use a paper clip and pencil as the spinner. Spin to determine which problem each student is responsible for solving. Mean, Median, Mode, Variance & Standard Deviation.Formulas are provided on the sheet. Page 2 - Probability extension - Drawing tree diagrams and answering theoretical probability questions based on the spinners.Pr
Subjects:
Grades:
10th - 12th
Types:
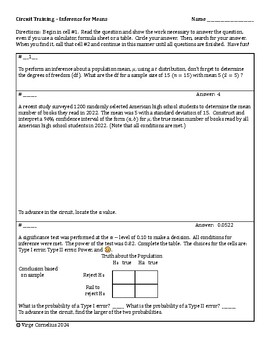
Circuit Training -- Inference for Means (Statistics)
This 12-question circuit will give your students practice with all the details needed to perform inference for means. My colleagues and I check our circuits very carefully but if you find any errors or get stuck, please use email virge@virgecornelius.com.
Subjects:
Grades:
11th - 12th, Higher Education
Types:
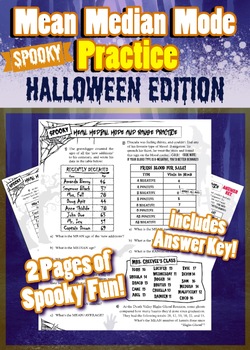
Halloween Mean Median Mode Range Practice - Spooky and Fun Math Handout
Spooky and FUN Mean Median Mode Range Practice - Halloween Printable ActivityEven your most ghoulish students will love this handout! It's full of hilarious scenarios and monster names, and includes lots of spooky fonts and icons. Your students will be so entertained by this printable, that they'll forget they're improving their math skills while using it.Since each problem on the handout is a multi-part problem, this handout features over 25 chances for students to improve their statistical ana
Subjects:
Grades:
4th - 9th, Adult Education
Types:
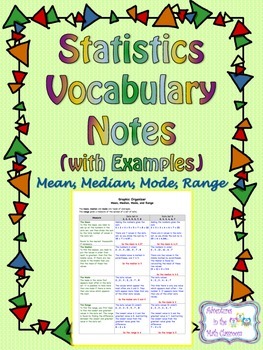
Statistics Vocabulary Notes - Mean, Median, Mode, Range
These color-coded vocabulary notes help students find the mean, median, mode, and range of a data set through example. There are two sets of data that are used to show students the different possible outcomes when it comes to finding the mean, median, mode, and range of a data set.
Subjects:
Grades:
4th - 9th
Types:
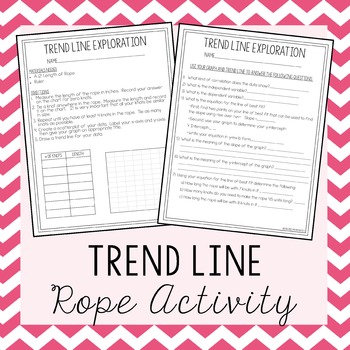
Trend Line Activity ~ Knots in a Rope
***This activity requires each student to have a 12" length of rope and a ruler***
Students collect data by tying knots in a rope and recording the length of the rope after each knot. Students then use this data to do the following:
~Create a Scatterplot
~Draw a Trend Line
~Write an equation in slope-intercept form for the trend line
~Use the equation of their trend line to make predictions
o Click Here for more Functions & Linear Equations activities
o Click Here for more 8th Grade Math
Subjects:
Grades:
6th - 9th
Types:
Also included in: 8th Grade Math Bundle ~ All My 8th Grade Math Products at 1 Low Price
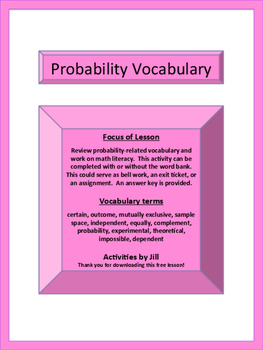
Probability Terms Worksheet with Word Bank (Distance Learning)
Focus of LessonReview probability-related vocabulary and work on math literacy. This activity can be completed with or without the word bank. This could serve as bell work, an exit ticket, a math center, or an assignment.Vocabulary termscertain, outcome, mutually exclusive, sample space, independent, equally, complement, probability, experimental, theoretical, impossible, dependentUse this note-taking product to introduce the vocabulary terms!Probability Vocabulary NotesCCSS 7.SPProbability Te
Subjects:
Grades:
6th - 9th
Types:
School's Out! (almost) Fun Box and Whisker plot activity Algebra
The school year is winding down and your students have worked hard and in need of a fun activity. Since their minds are already thinking of summer activities, why not show them that Math can be fun and create a box-and-whisker plot on Teen favorite summer activities? Besides, it's free.
This printable contains 18 favorite activities for teens in the summer. Have your students rank their favorite ten, collect the data (all anonymous) and have them create a box-and-whisker plot or stem-leaf,
Subjects:
Grades:
7th - 12th
Types:
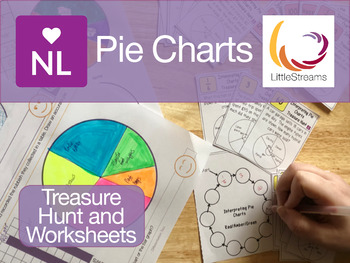
Pie Charts Drawing & Interpreting (Worksheets and Scavenger Hunt)
#freebiefridayThis free download is brought to you in collaboration with LittleStreams and it combines two fully differentiated resources covering drawing, reading and interpretation of pie charts. The first is a pack of six worksheets by LittleStreams the first four are of increasing difficulty drawing pie charts from tables and another two worksheets of increasingly difficulty drawing pie charts from bar charts. Solutions are provided for each worksheet. The second pack in this free download
Subjects:
Grades:
5th - 9th
Types:
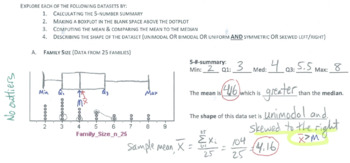
Statistics and Data Analysis: 5-number summary, box plots, and outliers
An introduction to data analysis, this 2-page handout (with answer KEY!) provides 6 datasets to analyze. Students compute the 5-number summary, make a box plot, describe the shape of a data set and relate the shape to the mean/median relationship, then finally go back through and check for outliers.
Subjects:
Grades:
9th - 12th
Types:

STEM Poster - 6 Reasons Why STEM Jobs are Good Jobs
STEM jobs are in high demand, and opportunities for high-paying jobs in science, technology, engineering, and math are plentiful. Encourage your students to explore careers within the fields of STEM with this simple yet informative infographic. Six convincing statistics are presented regarding lucrative STEM careers - print out as a poster for your classroom or use as a printable with students as part of real-world math, science, technology, or engineering application. Includes one 8.5x11 landsc
Subjects:
Grades:
5th - 12th
Types:
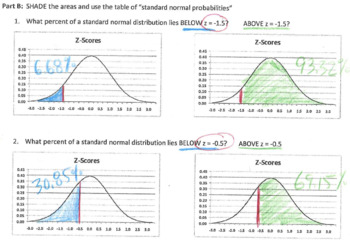
Statistics sketches: Z-scores and percentiles
Students will make a connection between z-scores and percentiles by shading the area under a bell curve (actually, 10 areas under 10 bell curves!). Finally, students will create a box plot under a standard normal distribution in order to make a strong connection between the unimodal symmetric normal distribution and its box plot.
Subjects:
Grades:
9th - 12th
Types:
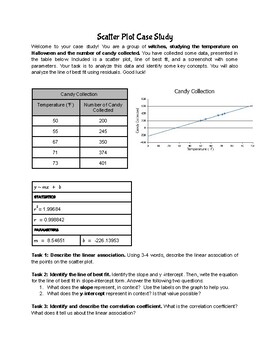
Scatter Plot and Residuals Case Study Worksheet -Includes Halloween Option!
Here are 4 separate scatter plot case studies for students to practice with. In this worksheet, students will focus on the following concepts:-Analyzing a table of data points and a graph with the line of best fit-Identifying slope and y-intercept in context-Identifying the correlation coefficient and its meaning-Calculating and plotting residuals to analyze the line of best fitWe did this lesson around Halloween and students worked in groups. You could go one step further and have students pres
Subjects:
Grades:
7th - 10th
Types:
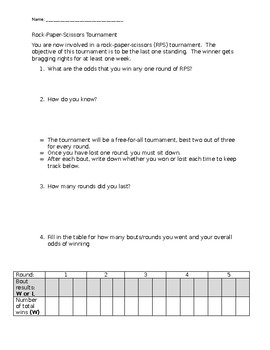
Exploring probability and independence playing rock-paper-scissors
Students follow prompts about the classic game of rock-paper-scissors. they will engage in a teacher-led tournament of RPS, and will investigate the outcomes of it. Teacher instructions and tips are included.
Subjects:
Grades:
9th - 12th
Types:
Showing 1-24 of 128 results


