Mama Litta's Cafe
76 Followers
Grade Levels
8th - 11th, Homeschool
Subjects
Resource Type
Formats Included
- Word Document File
- Internet Activities
Pages
2 pages
Mama Litta's Cafe
76 Followers
Compatible with Digital Devices
The Teacher-Author has indicated that this resource can be used for device-based learning.
Description
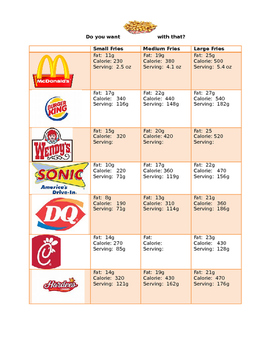
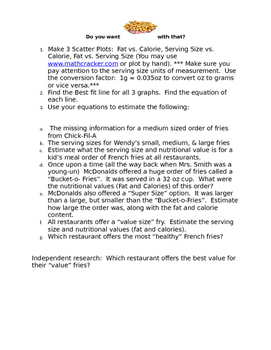
Students will compare the nutritional values and serving sizes of french fries from various fast food restaurants. Based on this information, they will create scatter plots, best lines of fit and the equation of the trend line. Using the equation, they will estimate the unknown values of kid meals and supersized portions of french fries.
Total Pages
2 pages
Answer Key
N/A
Teaching Duration
N/A
Report this resource to TPT
Reported resources will be reviewed by our team. Report this resource to let us know if this resource violates TPT’s content guidelines.


