The Clever Clover
2.3k Followers
Grade Levels
6th - 9th, Adult Education, Homeschool
Subjects
Resource Type
Standards
CCSS6.SP.B.4
CCSS6.SP.B.5
CCSS7.SP.B.3
Formats Included
- PDF
Pages
2 + answer documents
The Clever Clover
2.3k Followers
Also included in
- Are your kids studying the measures of central tendency, box and whisker plots, stem and leaf plots, two-way tables, histograms and scatter plots? This valuable resource includes guided notes, worksheets, scavenger hunts, assessments and more that you can use for your statistics unit. Below you willPrice $20.80Original Price $26.00Save $5.20
Description
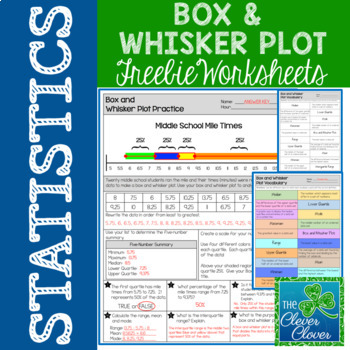
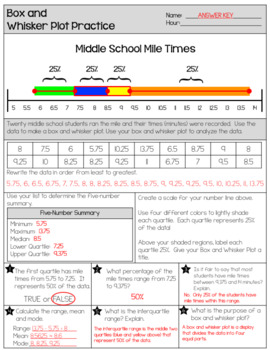
This resource can be used for practice with creating and interpreting box and whisker plots. Students will use twenty mile times in order to calculate the five number summary. Space is provided for students to list the numbers in order from least to greatest. Students are directed to shade and label each quartile of the box and whisker plot. After the plot has been drawn, students can answer six questions pertaining to the data.
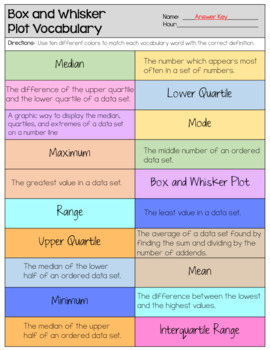
Practice with vocabulary is also important. Students can use colored pencils or markers to match ten statistic vocabulary words with their correct definitions. The ten words include:
✎ Range
✎ Mean
✎ Median
✎ Mode
✎ Minimum
✎ Maximum
✎ Lower Quartile
✎ Upper Quartile
✎ Interquartile Range
✎ Box and Whisker Plot
You may also be interested in the following resource: Box and Whisker Plots: Notes and Worksheets
Leaving feedback will earn you credits for future TPT resources. Follow me to receive discounts for the first 24 hours on new resources.
Please contact me if you have any questions. The Clever Clover
Connect with me on social media!
The Clever Clover - Pinterest
The Clever Clover - Instagram
The Clever Clover - Facebook
Total Pages
2 + answer documents
Answer Key
Included
Teaching Duration
45 minutes
Report this resource to TPT
Reported resources will be reviewed by our team. Report this resource to let us know if this resource violates TPT’s content guidelines.
Standards
to see state-specific standards (only available in the US).
CCSS6.SP.B.4
Display numerical data in plots on a number line, including dot plots, histograms, and box plots.
CCSS6.SP.B.5
Summarize numerical data sets in relation to their context, such as by:
CCSS7.SP.B.3
Informally assess the degree of visual overlap of two numerical data distributions with similar variabilities, measuring the difference between the centers by expressing it as a multiple of a measure of variability. For example, the mean height of players on the basketball team is 10 cm greater than the mean height of players on the soccer team, about twice the variability (mean absolute deviation) on either team; on a dot plot, the separation between the two distributions of heights is noticeable.


