183 results
High school statistics assessments for Google Apps
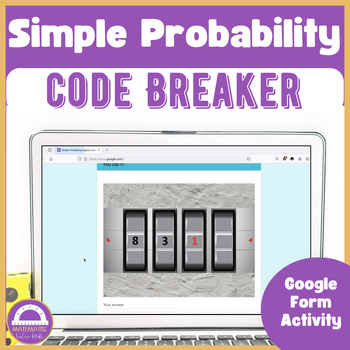
Simple Probability | Digital Escape Room Code Breaker Activity
Ready to break the code by solving probability problems? This Simple Probability | Digital Escape Room Code Breaker includes 20 problems that you and your students must solve to figure out how to open the safe! This Google Form activity is perfect to have 7th grade students practice solving probability problems while having fun.EDIT: Added a set of printable task cards, handouts and solutions.I would use this activity as a way to practice solving probability with my students. You could use this
Subjects:
Grades:
6th - 9th
Types:
Also included in: Bundle Statistics and Probability | 50% Discount
Version B End of Unit Assessments/Retakes for IM Algebra 1 Math™ Units 1-7
This is a Version B Assessment bundle aligned to Illustrative Mathematics for Algebra 1. This Version B assessment bundle is aligned to the same CCSS standards as the original exams and is modeled after the same type of problems accompanying the Algebra 1 exams. So, it naturally lends to standards based grading, if that is a practice in which you choose to participate. This exam can be used as a retake for students to show mastery after reteaching lessons or student independent study or it can b
Subjects:
Grades:
8th - 11th
Types:
CCSS:
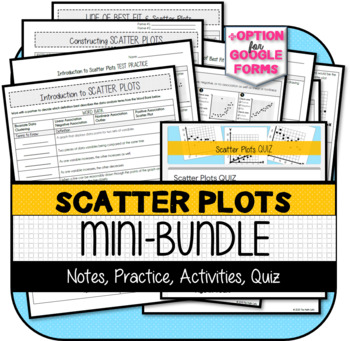
Scatter Plots MINI-BUNDLE
NOTE: Google Apps Options - Only the ASSESSMENTS have Google Apps options. This bundle is NOT ideal for "Distance Learning" unless you have special access to PDF editors that remove answer keys, etc.This resource was developed to meet the requirements of the 8th Grade Statistics & Probability Standards below:CCSS.MATH.CONTENT.8.SP.A.1Construct and interpret scatter plots for bivariate measurement data to investigate patterns of association between two quantities. Describe patterns such as cl
Subjects:
Grades:
7th - 9th
Types:
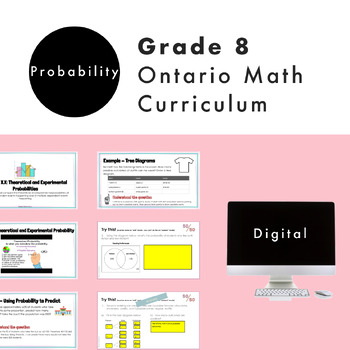
Grade 8 Ontario Math Probability Digital Google Slides + Form
Do you need a practical and engaging resource for the NEW Ontario Math Number strand? Are you planning for the NEW Grade 8 Ontario Math Curriculum? This editable Google Slide resource is what you need! This resource is for the Grade 8 DATA strand and covers specific expectations for “D2 Probability". In this resource, students will experience math through engaging real-life questions, storytelling through math, and interactive slides. What’s Included2 Google Slide presentations67 UNIQUE and ED
Subjects:
Grades:
7th - 9th
Types:
Also included in: Grade 8 NEW Ontario Math Curriculum Full Year Digital Slides Bundle
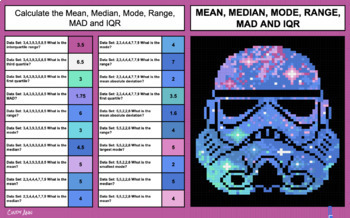
Math Pixel Art - Mean, Median, Mode, Range, MAD and IQR - May the Fourth
Math Pixel Art - Mean, Median, Mode, Range, MAD and IQR - May the Fourth - Abstract Trooper- Let your students skill practice come to life with this solve and reveal pixel art. With each correct answer the pixels appear. Finish all your skill drills, and you have an awesome Star Wars™️ themed picture! Celebrate May the Fourth with colorful solve and reveal pixel art.Students calculate the Mean, Median, Mode, Range, MAD and IQR to reveal a pixel art image in Google™ Sheets piece by piece. The im
Subjects:
Grades:
7th - 12th
Types:

Dot Plots, Histograms, and Box Plots Quiz for Google Forms™ - 6.SP.4
About This Resource:This is a Google Forms Quiz on creating and interpreting dot plots, histograms, and box plots. The instructions are easy to follow for you to make a copy of the quiz to your Google Drive. Then you can assign to your students using Google Classroom or some other method.Questions on this assessment were carefully created to give our students the best practice on the following standard.6.SP.4 - Display numerical data in plots on a number line, including dot plots, histograms, an
Subjects:
Grades:
6th - 10th
Types:
CCSS:
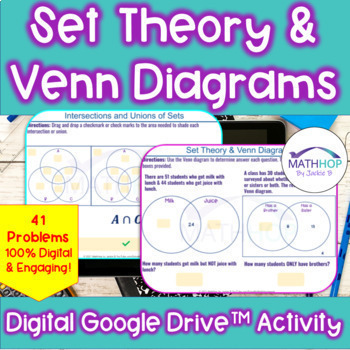
Set Theory & Venn Diagrams (Intersections, Unions, Complements)
Need engaging additional practice on unions, intersections, complements of sets using Venn diagrams? Students drag and drop to shade intersections, complements, & unions, they type directly into slides to create Venn diagrams and use unions, intersections, and complements to answer questions based on Venn diagrams. This activity includes 41 problems to solidify student understanding, completely digital NO Prep needed. Includes 41 Problems that cover:•Determine intersection of sets•Determine
Subjects:
Grades:
9th - 12th
Types:
CCSS:
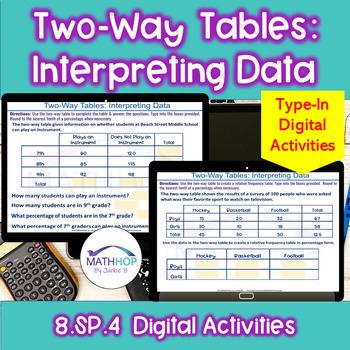
Two-Way Tables & Relative Frequency Tables: Interpreting Data - Digital Activity
Need engaging practice for students to practice interpreting data from two-way tables & relative frequency tables and creating relative frequency tables? This collection of NO PREP Digital problems provide practice on creating & interpreting two-way tables & relative frequency tables in percentage form. Students struggle with data in two-way tables but practice CAN BE engaging. These digital activities that can be used as homework, assessments, supplemental activities.⭐ 12 total slid
Subjects:
Grades:
8th - 9th
Types:
CCSS:
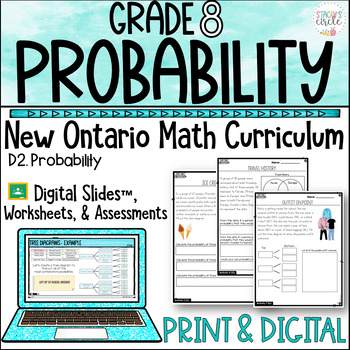
Grade 8 Ontario Math Probability Printable and Digital Unit
Are you an Ontario Math Teacher looking to excite and engage your math learners with a no-prep complete Grade 8 Probability Unit in digital AND printable formats? If you're tired of pulling resources from multiple different sources, then this comprehensive Ontario Curriculum-aligned resource by Stacey's Circle is the solution!NOTE: This resource covers the specific expectations -D2.1 and D2.2Your purchase comes in PRINT & DIGITAL Formats.WHY BUY THIS PRODUCT OVER OTHERS?My vision for teachin
Subjects:
Grades:
7th - 9th
Types:

Measures of Center and Spread |Mean, Median, Standard Deviation, +|Google Forms™
Included in this Product: 100% Self-Grading Assessment or Homework using Google Forms™ - Measures of Center and Spread - Mean, Median, Range, Interquartile Range, Standard Deviation - 26 Questions each (9 multiple choice, 15 free response, and 2 checkbox). The default multiple choice answer order is generally set to be "shuffled" to prevent cheating. However, this can be edited. 2 similar versions for the price of 1!! Having a second version of the form allows for retakes and also gives you opt
Subjects:
Grades:
8th - 12th
Types:
CCSS:
Also included in: Algebra 2 Google Forms™
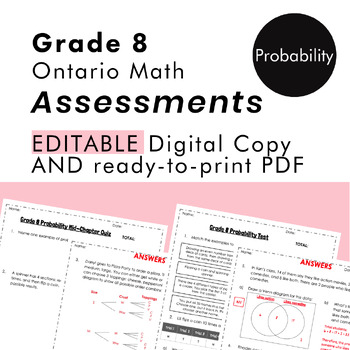
Grade 8 Ontario Math - Probability Assessments - PDF + Google Slides
This resource is for the Grade 8 DATA strand of Probability. ***This resource is meant to be used with my Grade 8 Probability digital unit but can also be used separately.*** Do you need summative assessments for the NEW Ontario Math Curriculum? This NO-PREP, PDF and editable resource is what you need! This resource contains summative assessments for your students to apply what they have learned in the Data strand. This package contains 2 assessments: a Mid-Chapter Quiz and a Unit Test. The ass
Subjects:
Grades:
7th - 9th
Types:
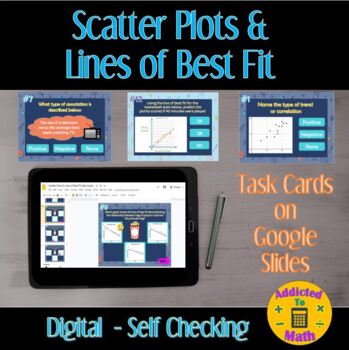
Digital Scatter Plot & Line of Best Fit Self-Checking Activity on Google Slides
This is a fun, interactive, self-checking progressive google slide activity on scatter plots and lines of best fit. Sample topics include naming the type of correlation, writing the equation for the line of best fit, and making predictions. There are 12 questions total.When a student chooses the wrong answer they will see an "X" appear. When students click and choose the correct answer they will see a smiley face appear.This activity is perfect for distance learning, small groups, and independen
Subjects:
Grades:
8th - 12th
Types:
Also included in: Digital Scatter Plot & Line of Best Fit Activity BUNDLE #2
Google Forms™ Quiz - Scatter Plots - 8.SP.1-3 - Distance Learning
About This Resource:This is a Google Forms Quiz on scatter plots. The instructions are easy to follow for you to make a copy of the quiz to your Google Drive. Then you can assign to your students using Google Classroom or some other method.Questions on this assessment were carefully created to give our students the best practice on the following standard.8.SP.1 - Construct and interpret scatter plots for bivariate measurement data to investigate patterns of association between two quantities. De
Subjects:
Grades:
8th - 12th
Types:
CCSS:
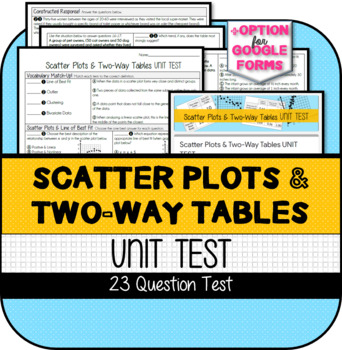
Scatter Plots & Two-Way Tables UNIT TEST (Printable & version for Google Forms)
This resource was developed to meet the requirements of the 8th Grade Statistics & Probability Standards below:CCSS.MATH.CONTENT.8.SP.A.1 Construct and interpret scatter plots for bivariate measurement data to investigate patterns of association between two quantities. Describe patterns such as clustering, outliers, positive or negative association, linear association, and nonlinear association.CCSS.MATH.CONTENT.8.SP.A.2 Know that straight lines are widely used to model relationships between
Subjects:
Grades:
7th - 9th
Types:
Also included in: Scatter Plots & Two-Way Tables UNIT BUNDLE

Digital Scatter Plot & Line of Best Fit Activity BUNDLE #2
Engage students with a variety of DIGITAL and PAPERLESS activities that support scatter plots and lines of best fit. These 4 resources help students classify the three different correlations from both a scatter plot and application scenario, identify and write lines of best fit, make predictions from scatter plots and lines of best fit, and finally distinguish between facts and false statements regarding the topic.Students will have fun in a variety yet challenging set of activities. You will e
Subjects:
Grades:
8th - 11th
Types:
Version B End of Unit Assessment/Retake for IM Algebra 1 Math™ Unit 1
This is a Version B End of Unit Assessment aligned to Illustrative Mathematics, Unit 1 (One-variable Statistics) for Algebra 1. This Version B assessment is aligned to the same CCSS standards as the original exam and is modeled after the same type of problems accompanying Unit 1 for Algebra 1. So it naturally lends to standards based grading, if that is a practice in which you choose to participate. This exam can be used as a retake for students to show mastery after reteaching lessons or studen
Subjects:
Grades:
8th - 12th
Types:
CCSS:
Moneyball Movie Quiz | Guide | Worksheet | 35 Questions | Self-Grading
This simple, yet effective, multiple choice quiz is meant to supplement the viewing of the movie Moneyball in the classroom. The questions are in chronological order and evenly spaced throughout the movie. Although multiple choice questions do not always allow for in-depth thinking and analysis, teachers can optionally use the included 15 debriefing discussion prompts to engage students in discussion and critical thinking after completing the quiz and watching the movie. This product includes
Grades:
9th - 12th
Types:
IB Psychology Internal Assessment (IA) Analysis and Statistics Slides
Walk your students through the Analysis section of the Internal Assessment (IA). Google slides include content and background information on statistics, directions and links for students to follow while they write their Analysis section, create their table and graph, and run descriptive statistics and inferential statistics with their raw data. Includes links to online calculators for mean, standard deviation, Mann Whitney U Test, Wilcoxon Test. Analysis rubric and links to two IA exemplars incl
Subjects:
Grades:
9th - 11th, Higher Education, Adult Education
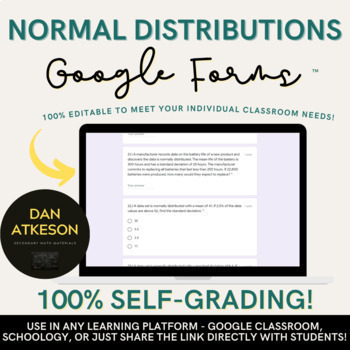
Normal Distributions using Google Forms™ | Empirical Rule
Included in this Product: 2 similar versions for the price of 1!! Having a second version of the form allows for retakes and also gives you options to modify for specific students. You could use one form as a review and the second form as an assessment. It could also be used to prevent cheating by giving students different versions. 100% Self-Grading Assessment or Homework using Google Forms™ - Normal Distributions - 25 Questions each (15 multiple choice, 8 free response, and 2 checkbox). The d
Subjects:
Grades:
9th - 12th
Types:
Also included in: Algebra 2 Google Forms™
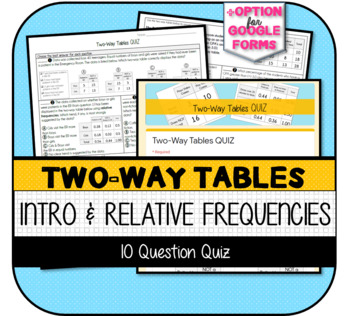
Two-Way Tables QUIZ (Printable & Version for Google Forms)
This resource was developed to meet the requirements of the 8th Grade Statistics & Probability Standards below:CCSS.MATH.CONTENT.8.SP.A.4 Understand that patterns of association can also be seen in bivariate categorical data by displaying frequencies and relative frequencies in a two-way table. Construct and interpret a two-way table summarizing data on two categorical variables collected from the same subjects. Use relative frequencies calculated for rows or columns to describe possible ass
Subjects:
Grades:
7th - 9th
Types:
CCSS:
Google Forms™ Quiz - Compound Probability - 7.SP.8 - Distance Learning
About This Resource:This is a Google Forms Quiz on compound probability. The instructions are easy to follow for you to make a copy of the quiz to your Google Drive. Then you can assign to your students using Google Classroom or some other method. Please see the preview for screenshots of the exact questions on the assessment. Questions on this assessment were carefully created to give our students the best practice on the following standard.7.SP.8 - Find probabilities of compound events using o
Subjects:
Grades:
7th - 12th
Types:
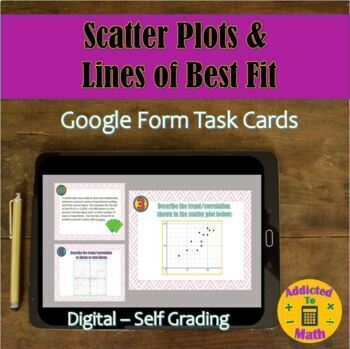
Digital Scatter Plots and Lines of Best Fit Google Form Task Cards
Digital, paperless, and self-grading! In this READY TO GO digital scatter plot and line of best fit activity, students will answer 10 task cards (multiple choice) about trends/correlations of scatter plots, using lines of best fit to make predictions, and interpreting the meaning of the y-intercept in situations. This activity is a great way to allow students to use technology and get immediate feedback! The form is ready to send out, and bonus, it will grade it for you! Students will use a Goog
Subjects:
Grades:
8th - 12th
Types:
Also included in: Digital Scatter Plot & Line of Best Fit Activity BUNDLE #2
Crash Course Statistics Quizzes - Episodes 1-15
Crash Course Statistics Quizzes are included to accompany the following episodes:What is Statistics? Crash Course Statistics #1Mathematical Thinking: Crash Course Statistics #2Mean, Median, and Mode: Measures of Central Tendency: Crash Course Statistics #3Measures of Spread: Crash Course Statistics #4Charts Are Like Pasta - Data Visualization Part 1: Crash Course Statistics #5Plots, Outliers, and Justin Timberlake: Data Visualization Part 2: Crash Course Statistics #6The Shape of Data: Distribut
Subjects:
Grades:
9th - 12th
Types:
Google Forms™ Quiz - Linear Residual Plots
About This Resource:This is a Google Forms Quiz on linear residual plots. The instructions are easy to follow for you to make a copy of the quiz to your Google Drive. Then you can assign to your students using Google Classroom or some other method.Questions on this assessment were carefully created to give our students the best practice on the following standard.S.ID. 6 - Represent data on two quantitative variables on a scatter plot, and describe how the variables are related.S.ID.6a - Fit a fu
Subjects:
Grades:
9th - 12th
Types:
CCSS:
Showing 1-24 of 183 results


