44 results
High school statistics handouts for Google Apps
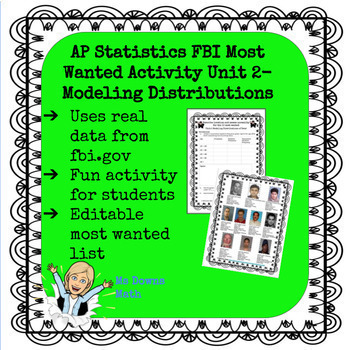
FBI Most Wanted AP Statistics, Modeling Data, Z scores and Normal Distributions
I created a series of activities for several units in the AP Statistics curriculum. The students love using data from fbi.gov to review concepts. This activity involves analyzing data related to the top 10 most wanted fugitives. I created this activity in May of 2020 and used the top 10 at that time. In the folder, you will find an editable slide of the top 10 if you want to change it.The answer key for the unit is based on the original top 10 that I used. Teachers have the option of having stud
Subjects:
Grades:
9th - 12th
Types:
CCSS:
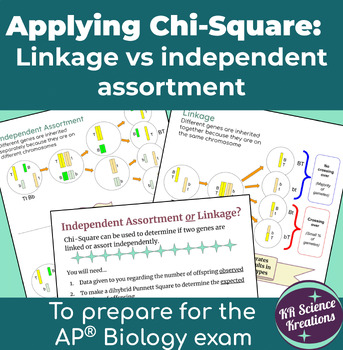
KR's Chi-Square to Determine Independent Assortment vs Linkage for AP® Biology
After teaching Chi-Square to your AP® Biology students, have them apply Chi-Square to determine if 2 genes are linked or not. Don’t worry….this step-by-step activity has everything you need to teach your students how to determine linkage vs independent assortment using Chi-Square analysis. This is an AP® Biology exam topic with very few resources available out there!WHY IS IT HELPFUL?Don’t let your students get caught off guard on their AP® Biology exam. Linkage questions are actually quite eas
Subjects:
Grades:
10th - 12th
Types:

FBI Most Wanted AP Statistics Analyze Categorical and Quantitative Data
I created a series of activities for several units in the AP Statistics curriculum. The students love using data from fbi.gov to review concepts. This activity involves analyzing data related to the top 10 most wanted fugitives. I created this activity in May of 2020 and used the top 10 at that time. In the folder, you will find an editable slide of the top 10 if you want to change it.The answer key for the unit is based on the original top 10 that I used. Teachers have the option of having stud
Subjects:
Grades:
9th - 12th
Types:
CCSS:
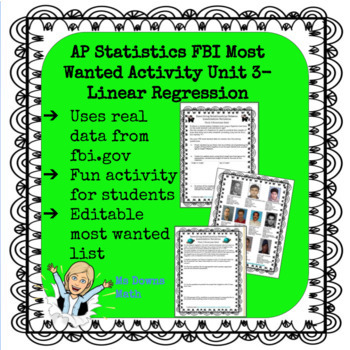
FBI Most Wanted AP Statistics Linear Regression
I created a series of activities for several units in the AP Statistics curriculum. The students love using data from fbi.gov to review concepts. This activity involves analyzing data related to the top 10 most wanted fugitives. I created this activity in May of 2020 and used the top 10 at that time. In the folder, you will find an editable slide of the top 10 if you want to change it.The answer key for the unit is based on the original top 10 that I used. Teachers have the option of having stud
Subjects:
Grades:
9th - 12th
Types:
CCSS:
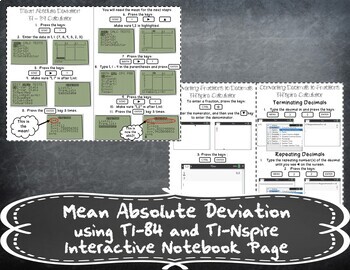
Mean Absolute Deviation using a Calculator Handout Notes (TI-84 and TI-Nspire)
Mean Absolute Deviation using a Calculator Handout Notes (TI-84 and TI-Nspire)THIS FILE NOW CONTAINS THE PDF VERSION OF THIS PRODUCT PLUS A GOOGLE SLIDES VERSION FOR DISTANCE LEARNINGTHIS PRODUCT IS NOW INCLUDED IN Statistics with Univariate Data - Unit 2 - 8th Grade-Notes + Distance Learning Bundle!This product contains a handout notes page for Mean Absolute Deviation using the TI-84 Calculator and TI-Nspire Calculator.This product includes:- Link to mp4 Video Notes- Embedded Video Notes in Goo
Subjects:
Grades:
8th - 9th
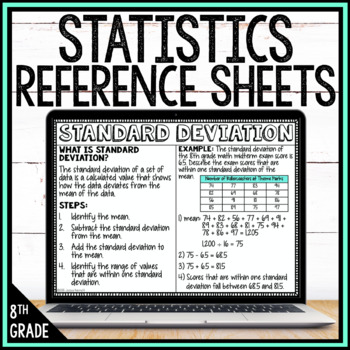
8th Grade Math Anchor Chart Reference Sheets
This resource is an excellent tool for home or distance learning. It comes in both PDF form for printing or Google Slides™ for students to receive digitally. There are a total of 13 student-friendly, anchor chart reference sheets aligned to The Statistics and Probability Domain of 8th-grade math! Each chart includes information about the topic, steps to solve, and an example. This resource is excellent for enhancing classroom instruction, aiding in individual or group work, and offers a "go-to"
Subjects:
Grades:
7th - 9th
Also included in: 8th Grade Math Anchor Chart Reference Sheets Posters
NOVA: Prediction by the Numbers Video Questions Worksheet
The power of numbers and data in predicting the future is demonstrated by the branch of mathematics known as statistics. Areas such as weather forecasting, election polling, sports analytics, and Coast Guard search and rescue capabilities all rely upon discoveries and approaches first presented by people such as Sir Francis Galton, Pierre de Fermat, Blaise Pascal, and Thomas Bayes. These insights, combined with today’s computing power, permit our modern predictive capability. With machine learni
Grades:
11th - 12th
Types:
Also included in: NOVA Mathematics Video Questions Worksheet Bundle
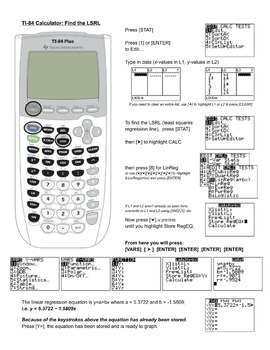
Find LSRL and Graph LSRL and Scatter Plot on TI-84 Calculator
This is a step-by-step handout for students to learn to find and graph a Least Squares Regression Line on the Ti-84 Graphing Calculator.The handout includes images from the TI-84.This handout is the 2nd of a series. See "Enter Data in TI-84 Calculator to Find 1-Var Statistics" for the 1st handout I would have students use.Because Statistics often prefers y=a+bx, that form is reference in the Google Doc. However, if you prefer to use the form y=ax+b, it would be a simple edit to change the "8:L
Subjects:
Grades:
10th - 12th, Higher Education
Types:
CCSS:

Experimental vs. Theoretical Probability (FULL VERSION)
Here is a short little activity that I came up with to help students understand the Law of Large Numbers and the Difference between Experimental and Theoretical Probability. This "Paid Version" Includes tiles with cute art on them to emphasize the cats vs dogs idea in the prompt. I appreciate your business!!Cut out the pink and blue "tiles" or squares of paper/cardstock. I typically use 15 pink and 20 blue for this activity, but you can double this and make it a bigger experiment, if you like! T
Subjects:
Grades:
11th - 12th
Types:
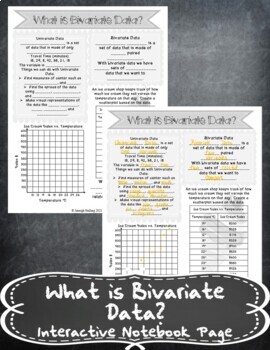
What is Bivariate Data? Notes Handout + Distance Learning
What is Bivariate Data? Notes HandoutTHIS FILE NOW CONTAINS THE PDF VERSION OF THIS PRODUCT PLUS A GOOGLE SLIDES VERSION FOR DISTANCE LEARNINGThis handout covers:- Univariate Data Review- Bivariate Data Introduction- Creating a ScatterplotThis product includes:- Pictures of the finished foldable in my INB- Link to mp4 Video Notes- Embedded Video Notes in Google Slides FileAnswer keys are included and will print in a way where they can be used for students with accomodations such as copy of class
Subjects:
Grades:
8th - 9th
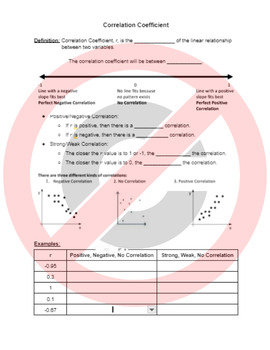
Correlation Coefficient Notes
A quick, simple overview for correlation coefficient. All this does is help students identify positive/negative and weak/strong correlation given an r value or scatter plot.
Subjects:
Grades:
6th - 12th
Types:

Venn Diagram Probability Practice Booklet
Print this Slideshow as 1/4 slides or 1/2 slides for students to practice probability functions and how they correspond to the Venn Diagram. Keep as a booklet in their notes for extra help with studying.Answer Key Included. Thank you for Downloading!!! <3 <3 <3
Subjects:
Grades:
11th - 12th
Types:
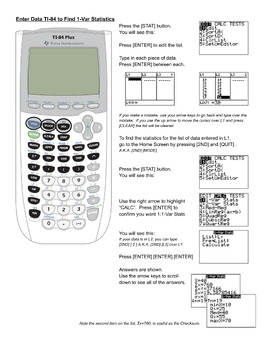
Enter Data in a TI-84 Calculator to Find 1-Var Statistics
This is a step-by-step handout for students to learn to enter data in a TI-84 Calculator to find statistics such as mean, median, standard deviation, quartiles, etc.The handout includes images from the TI-84.This handout is the 1st of a series. See "Find LSRL and Graph LSRL and Scatter Plot on TI-84 Calculator" for the 2nd handout.
Subjects:
Grades:
10th - 12th, Higher Education
Types:
CCSS:

Box and Whisker Plot
Students will collect data on temperatures in various states across the USA. Students will use this data to find the five-number summary and create a box and whisker plot.
Subjects:
Grades:
6th - 9th
Types:
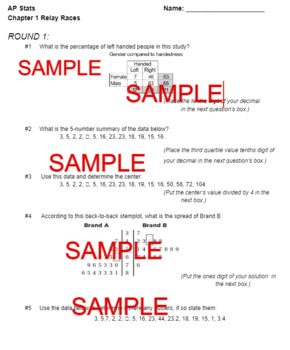
AP Statistics Chapter 1 Relay Race
Middle School and High School Statistics Discussion ActivityHere is a fun review game for your class to compete against each other!Student discovery and discussion on two major types of variables analyzed in statistics.Students will begin exploring and understanding data through the study of descriptive statistics. Students will learn to collect, properly display, analyze, and describe data.Directions: Find a partner, or a group, or work individually. Together you will work through each problem
Subjects:
Grades:
7th - 12th, Higher Education
Types:
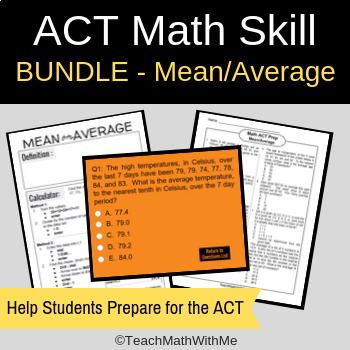
Math ACT Skill - Mean and Average BUNDLE - ACT Prep
This is a BUNDLE containing resources that provide practice for the math topic of MEAN/AVERAGE. Questions on this topic are seen often on the math section of the ACT. See the individual products included in the BUNDLE for more descriptions. Additional ACT Prep Material from Teach Math With Me:Math ACT Prep BUNDLE - All My Math ACT Prep Products Together!Math ACT Prep Curriculum BUNDLE6 Week Math Prep WorkbookMath ACT Prep Keywords Slides and Workbook - BUNDLE - 72 Words/QuestionsMath 5-A-Day
Subjects:
Grades:
9th - 12th
Types:
AP Statistics - AP Daily Videos: Unit 3 Google Form Companions - Collecting Data
Do you require your students to watch the awesome AP Daily videos that College Board provides? Me too! But I needed a way to ensure the students were actually watching this resource and taking away all the valuable information they contain. These Google Forms allowed me to confirm that students were making the most of the AP Daily videos.This download contains 11 google forms. Each form is a companion to the 11 AP daily videos located in the AP Statistics Unit 3: Collecting Data section.
Subjects:
Grades:
9th - 12th
CCSS:
Also included in: AP Statistics - 147 Google Form Companions for ALL AP Daily Videos
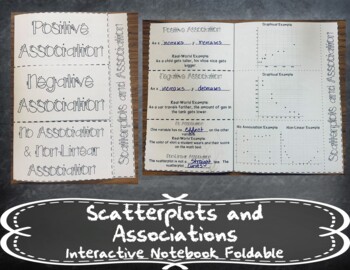
Scatterplots and Association Foldable + Distance Learning
Scatterplots and Association FoldableTHIS FILE NOW CONTAINS THE PDF VERSION OF THIS PRODUCT PLUS A GOOGLE SLIDES VERSION FOR DISTANCE LEARNINGThis foldable covers vocabu;ary, real-world examples, and graphical examples of:- Positive Association- Negative Association- No Association- Non-LinearThis product includes:- Pictures of the finished foldable in my INB- Step-by-step printing and folding instructions.- Link to mp4 Video Notes- Embedded Video Notes in Google Slides FileAnswer keys are inclu
Subjects:
Grades:
7th - 9th
Also included in: Application of Linear Functions - Unit 4 - Algebra 1 - Notes
AP Statistics - AP Daily Videos: Unit 1 Google Form Companions
Do you require your students to watch the awesome AP Daily videos that College Board provides? Me too! But I needed a way to ensure the students were actually watching this resource and taking away all the valuable information they contain. These Google Forms allowed me to confirm that students were making the most of the AP Daily videos.This download contains 14 google forms. Each form is a companion to the 14 AP daily videos located in the AP Statistics Unit 1: One Variable Data section.
Subjects:
Grades:
9th - 12th
CCSS:
Also included in: AP Statistics - 147 Google Form Companions for ALL AP Daily Videos
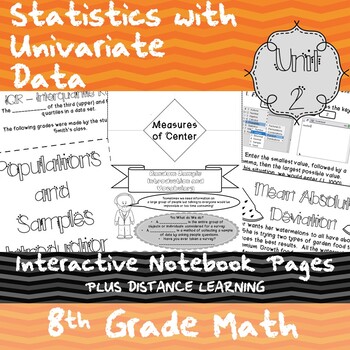
Statistics with Univariate Data - Unit 2 - 8th Grade-Notes + Distance Learning
This bundle contains just the Interactice Notebook Pages included in my Unit 2 - 8th Grade Math - Curriculum.THIS FILE NOW CONTAINS THE PDF VERSION OF THIS PRODUCT PLUS A GOOGLE SLIDES VERSION FOR DISTANCE LEARNING9 Foldables and Notes Pages that cover:• Measures of Center• Mean Absolute Deviation• Mean Absolute Deviation using a Calculator• Populations and Samples• Random Samples• Generating Random Samples using a Calculator• BONUS: Glossary• BONUS: Measures of Center Frayer Model• BONUS: Mean
Subjects:
Grades:
7th - 9th
Also included in: Statistics with Univariate Data - Unit 2 - 8th Grade + Distance Learning
AP Statistics - AP Daily Videos: Unit 5 Google Form Companions
Do you require your students to watch the awesome AP Daily videos that College Board provides? Me too! But I needed a way to ensure the students were actually watching this resource and taking away all the valuable information they contain. These Google Forms allowed me to confirm that students were making the most of the AP Daily videos.This download contains 15 google forms. Each form is a companion to the 15 AP daily videos located in the AP Statistics Unit 5: Sampling Distributions section.
Subjects:
Grades:
9th - 12th
CCSS:
Also included in: AP Statistics - 147 Google Form Companions for ALL AP Daily Videos
AP Statistics - AP Daily Videos: Unit 4 Google Form Companions - Probability
Do you require your students to watch the awesome AP Daily videos that College Board provides? Me too! But I needed a way to ensure the students were actually watching this resource and taking away all the valuable information they contain. These Google Forms allowed me to confirm that students were making the most of the AP Daily videos.This download contains 18 google forms. Each form is a companion to the 18 AP daily videos located in the AP Statistics Unit 4: Probability, Random Variables, a
Subjects:
Grades:
9th - 12th
CCSS:
Also included in: AP Statistics - 147 Google Form Companions for ALL AP Daily Videos
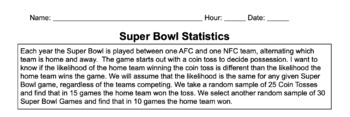
Super Bowl- 2 proportions Hypothesis test and Confidence interval
Problem 1 uses the State-Plan-Do set up (process described by Stats Medic) for a 2 proportion Hypothesis tests. Problems 2-5 lead the students through 2 proportion confidence interval. Suggested extension: show students how to do 2-proportion z test and z interval on the calculator. Why are these values not the same? (because the 2 proportions are not independent: Home team is more likely to win if they won the coin flip)
Subjects:
Grades:
11th - 12th
CCSS:
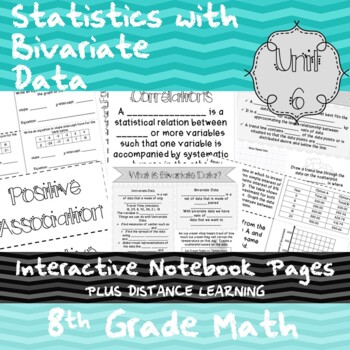
Statistics with Bivariate Data - Unit 6 - 8th Grade - Notes + Distance Learn
This bundle contains just the Interactice Notebook Pages included in my Unit 6 - 8th Grade Math - Curriculum.THIS FILE NOW CONTAINS THE PDF VERSION OF THIS PRODUCT PLUS A GOOGLE SLIDES VERSION FOR DISTANCE LEARNING9 Foldables and Notes Pages that cover:• Writing Linear Equations in Slope Intercept Form• Writing Equations from a Word Problems• Bivariate Data Introduction• Contrasting Linear and Non-Linear Data• Trend Line Introduction• Trend Lines and Correlations• Scatterplots and Associations•
Subjects:
Grades:
7th - 9th
Also included in: Statistics with Bivariate Data - Unit 6 - 8th Grade + Distance Learning
Showing 1-24 of 44 results


