TPT
Total:
$0.00

Two-Way Tables & Relative Frequency Tables: Interpreting Data - Digital Activity

Rated 5 out of 5, based on 7 reviews
5.0 (7 ratings)
;
MathHop by Jackie B
347 Followers
Grade Levels
8th - 9th, Homeschool
Subjects
Resource Type
Standards
Formats Included
  • Google Drive™ folder
Pages
12 slides, 36 problems
$3.25
$3.25
Share this resource
Report this resource to TPT
MathHop by Jackie B
347 Followers
Made for Google Drive™
This resource can be used by students on Google Drive or Google Classroom. To access this resource, you’ll need to allow TPT to add it to your Google Drive. See our FAQ and Privacy Policy for more information.

What educators are saying

I used this when I was absent and it was a great resource to practice interpreting data in two-way tables. I liked that it was self-checking so my students got immediate feedback.
My students enjoyed using this resource. It was something that was a different way for them to practice the concept.

Description

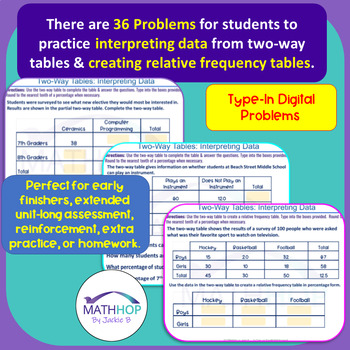
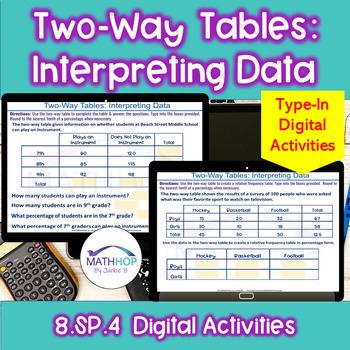
Need engaging practice for students to practice interpreting data from two-way tables & relative frequency tables and creating relative frequency tables? This collection of NO PREP Digital problems provide practice on creating & interpreting two-way tables & relative frequency tables in percentage form. Students struggle with data in two-way tables but practice CAN BE engaging. These digital activities that can be used as homework, assessments, supplemental activities.

12 total slides with 36 total problems

⭐ Answer Key Included

⭐ Can be done in class or given as a remote learning homework assignment. Perfect for

students needing additional practice.

Follow Me! to be notified about my products, sales, updates, and FREEBIES!

Connect with Me!

Use Hundreds of my Math Videos in Your Class!

Follow me on Facebook!

Follow me on Instagram!

Check out my custom course materials:

Algebra 1 Resources

Algebra 2 Resources

Geometry Resources

Precalculus Resources

Calculus Resources

Middle School Math

Elementary Math

Digital Activities

I WOULD LOVE YOUR FEEDBACK!

Remember to leave feedback and you will earn points toward FREE TPT purchases. I love your feedback!

LICENSING TERMS: This purchase includes a license for one teacher only for personal use in their classroom. Licenses are non-transferable, meaning they cannot be passed from one teacher to another. No part of this resource is to be shared with colleagues or used by an entire grade level, school, or district without purchasing the proper number of licenses. If you are a coach, principal, or district interested in transferable licenses to accommodate yearly staff changes, please contact me for a quote at MathHop321@gmail.com.

COPYRIGHT TERMS: This resource may not be uploaded to the internet in any form, including classroom/personal websites or network drives, unless the site is password protected and can only be accessed by students.

Products by MathHop by Jackie B, LLC may be used by the purchaser for their classroom use only. Use on Outschool is strictly prohibited. This is a single classroom license only. All rights reserved. Resources may only be posted online in an LMS such as Google Classroom, Canvas, or Schoology. Students should be the only ones able to access the resources.  It is a copyright violation to upload the files to school/district servers or shared Google Drives.

Total Pages
12 slides, 36 problems
Answer Key
Included
Teaching Duration
N/A
Report this resource to TPT
Reported resources will be reviewed by our team. Report this resource to let us know if this resource violates TPT’s content guidelines.

Standards

to see state-specific standards (only available in the US).
Understand that patterns of association can also be seen in bivariate categorical data by displaying frequencies and relative frequencies in a two-way table. Construct and interpret a two-way table summarizing data on two categorical variables collected from the same subjects. Use relative frequencies calculated for rows or columns to describe possible association between the two variables. For example, collect data from students in your class on whether or not they have a curfew on school nights and whether or not they have assigned chores at home. Is there evidence that those who have a curfew also tend to have chores?
Summarize categorical data for two categories in two-way frequency tables. Interpret relative frequencies in the context of the data (including joint, marginal, and conditional relative frequencies). Recognize possible associations and trends in the data.

Reviews

Questions & Answers

347 Followers