8 results
High school statistics laboratories for Google Apps

Wisconsin Fast Plants Online Simulation Lab
This comprehensive worksheet has students evaluate genetics using the free online lab through Gizmos (this simulation is currently FREE with the creation of an account (which is also FREE). Students will explore:- tracking parentage based on F1 and F2 phenotypes- statistical analysis using Chi Squared calculations - gene linkage evaluation and gene mapping using recombination frequencies Perfect for remote learning! Everything is included for guided learning AND independent practice to really g
Subjects:
Grades:
9th - 12th, Higher Education, Adult Education, Staff
Types:
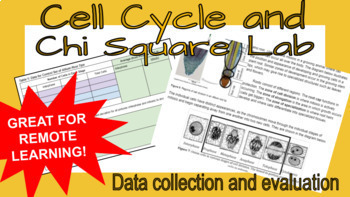
Cell Cycle Experimental Design Online Lab
Use data from real pictures of onion root tips to evaluate the effect of lectin on mitotic rate! A classic AP Biology Lab turned virtual for remote learning. Students use a google slide presentation to collect and share data, perform statistic testing (including standard deviation and Chi Square analysis) before evaluating the true effect of lectin on mitosis!Check out the data collection slides in the preview!
Subjects:
Grades:
9th - 12th, Higher Education, Adult Education, Staff
Types:
Also included in: Chi Square Bundle!

Paper Airplanes: Intro to Statistical Analysis
This is an experiment designed to be part of a Scientific Method unit in a science class. It introduces students to the idea of writing lab reports and using statistical analysis tools such as standard deviation, averages, T-Tests, and Null and Alternative Hypothesis. It can be modified depending on students comfort level with lab report writing and google sheets. There will be a supplemental product that has the Google Sheet Provided.
Subjects:
Grades:
9th - 12th
Types:

M&M Lab Instruction- Descriptive/Inferential Stats, Representative Sample/Size
Works for BOTH the new 2024 CED as well as the old 2019 CED.This lab is based on using M&Ms to help students understand the importance of sample size and representative samples when using inferential statistics (and comparing that to descriptive statistics). This Slides helps walk students walk through the activity step-by-step to reduce confusion and hopefully prevent the teacher from having to repeat instructions. Original Instructions taken from pages 38-40/42-44 of this free unit plan by
Subjects:
Grades:
10th - 12th
Types:
Experimental vs. Theoretical Probability (FULL VERSION)
Here is a short little activity that I came up with to help students understand the Law of Large Numbers and the Difference between Experimental and Theoretical Probability. This "Paid Version" Includes tiles with cute art on them to emphasize the cats vs dogs idea in the prompt. I appreciate your business!!Cut out the pink and blue "tiles" or squares of paper/cardstock. I typically use 15 pink and 20 blue for this activity, but you can double this and make it a bigger experiment, if you like! T
Subjects:
Grades:
11th - 12th
Types:

Paper Airplanes: Intro to Statistical Analysis Google Sheets
Supplemental Google Sheet for the Paper Airplane: Intro to Statistical Analysis Activity.
Subjects:
Grades:
9th - 12th
Types:
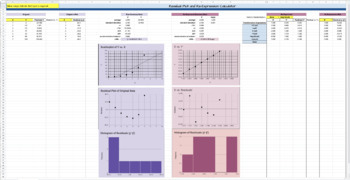
APStat: Residual and Re-expression Calculator
In AP Statistics, re-expression variables to fit an LSRL can be cumbersome on the calculator, without any real benefit to the student. This calculator is programmed to help students to easily see the relationship between a scatterplot and its residual plot for both re-expressed and raw (x,y) data values. This is a great tool to help students explore the Ladder of Powers for non-linear scenarios. The only values that need to be input are the raw data points. Students can also select the trans
Subjects:
Grades:
9th - 12th, Higher Education, Staff
Types:
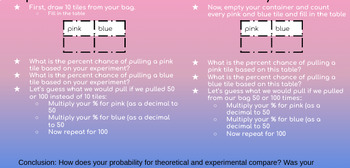
Experimental vs Theoretical Probability (FREE VERSION)
Here is a short little activity that I came up with to help students understand the Law of Large Numbers and the Difference between Experimental and Theoretical Probability. Cut out the pink and blue "tiles" or squares of paper/cardstock. I typically use 15 pink and 20 blue for this activity. The "pink" tiles are for cats and the "blue" tiles are for dogs.
Subjects:
Grades:
11th - 12th
Types:
Showing 1-8 of 8 results


