Measures of Center and Spread |Mean, Median, Standard Deviation, +|Google Forms™
Dan Atkeson
95 Followers
Grade Levels
8th - 12th
Subjects
Resource Type
Standards
CCSSHSS-ID.A.2
CCSSMP1
Formats Included
- Google Drive™ folder
- Internet Activities
Pages
2 Google Forms & 1 PDF tutorial
Dan Atkeson
95 Followers

Made for Google Drive™
This resource can be used by students on Google Drive or Google Classroom. To access this resource, you’ll need to allow TPT to add it to your Google Drive. See our FAQ and Privacy Policy for more information.
Also included in
- ✯ This full course bundle contains over 190 Self-Grading Algebra 2 Quizzes or Homework assignments using Google Forms™. Unit 1 - Algebra 2 FoundationsUnit 2 - Linear Functions and SystemsUnit 3 - MatricesUnit 4 - Quadratics and Complex NumbersUnit 5 - PolynomialsUnit 6 - Exponential and LogarithmicPrice $150.00Original Price $244.75Save $94.75
- Included in this Bundle: ✯26 Self-Grading Assessment or homework assignments using Google Forms™. 13 Topics for a total of 26 forms. Over 400 unique questions! Topics covered: ✯ Basic Theoretical Probability ✯ Independent & Dependent Events ✯ The Counting Principle ✯ Combinations ✯ PermutatioPrice $20.00Original Price $31.00Save $11.00
Description
Included in this Product:
- 100% Self-Grading Assessment or Homework using Google Forms™ - Measures of Center and Spread - Mean, Median, Range, Interquartile Range, Standard Deviation - 26 Questions each (9 multiple choice, 15 free response, and 2 checkbox). The default multiple choice answer order is generally set to be "shuffled" to prevent cheating. However, this can be edited.
- 2 similar versions for the price of 1!!
- Having a second version of the form allows for retakes and also gives you options to modify for specific students.
- You could use one form as a review and the second form as an assessment.
- It could also be used to prevent cheating by giving students different versions.
- 52 total questions. Topics Covered:
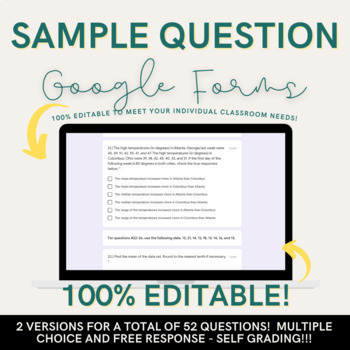
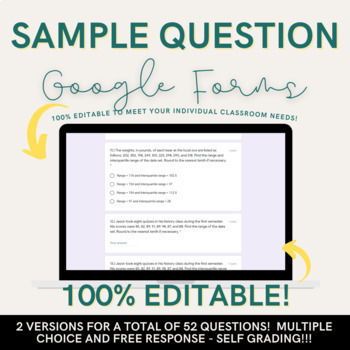
- Calculating mean, median, range, interquartile range, mean of the squared deviation, and standard deviation
- These forms are editable... So add or delete any of these topics as needed
- Comparing statistics if another number is added to the set
- Students are required to answer to the nearest tenth. (You could easily change this if you wanted students to round to the nearest whole number, hundredth, etc. All of my Google Forms™ are editable.)
- See sample questions above! The preview shows various types of questions on these Forms.
- Related Topics:
- Normal Distributions (no z-scores - 68%, 95%, & 99.7%)
- Z-Scores
- Find this product in the unit and full course bundles:
✯✯✯ Probability and Statistics - Algebra 2 Unit
✯✯✯ Algebra 2 BIG BUNDLE - Includes all A2 digital resources at half the price!
- Can easily be added to your Google Classroom™ or the link can be copied and pushed out to students.
- Students can complete the form via laptop, tablet, or phone!
- Easy to print for students that need a paper copy.
- You can use this as a quiz, homework, or even an exit ticket!
- 100% editable!!
- Easy to delete or add your own questions
- Edit questions or answer formats
- Import questions from your other forms
- Can easily add videos and other student aid (personal or Youtube )
- Allow or not allow students to see results after submission
- FREE BONUS PDF included!
- Editing Google Forms™ Tips & Tricks - Free tutorial showing you how to edit forms:
- Add questions, pictures, and videos
- Changing question type, answer keys, and answer options
- Adding custom student feedback
- And much more!
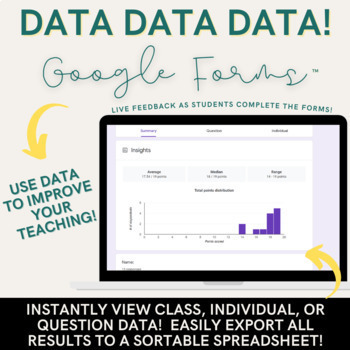
- You have immediate access to A LOT of data:
- Individual results
- Class results
- Statistics on individual questions
- Download spreadsheet with detailed class results
- I use Google Forms™ A LOT. Reach out anytime if you have questions on how you can edit the form to meet your needs!
- Click here to see other virtual learning products: More Online Math Resources!
Other Things You Should Know:
- This online resource was created using Google Forms™.
- You must have a Google™ account to access.
Thank you for taking time to review this product. Every product review earns you TPT credits that discount your future purchases (Roughly 5% back). Your reviews also help me improve and make better products! Click the green star ★ to follow my page! I will be adding virtual and online resources regularly!
Terms of use: Edit and use this form as needed for your classroom! Please do not sell or reproduce this for other classrooms or schools! Link to my TPT store: My Store
Total Pages
2 Google Forms & 1 PDF tutorial
Answer Key
Included
Teaching Duration
N/A
Report this resource to TPT
Reported resources will be reviewed by our team. Report this resource to let us know if this resource violates TPT’s content guidelines.
Standards
to see state-specific standards (only available in the US).
CCSSHSS-ID.A.2
Use statistics appropriate to the shape of the data distribution to compare center (median, mean) and spread (interquartile range, standard deviation) of two or more different data sets.
CCSSMP1
Make sense of problems and persevere in solving them. Mathematically proficient students start by explaining to themselves the meaning of a problem and looking for entry points to its solution. They analyze givens, constraints, relationships, and goals. They make conjectures about the form and meaning of the solution and plan a solution pathway rather than simply jumping into a solution attempt. They consider analogous problems, and try special cases and simpler forms of the original problem in order to gain insight into its solution. They monitor and evaluate their progress and change course if necessary. Older students might, depending on the context of the problem, transform algebraic expressions or change the viewing window on their graphing calculator to get the information they need. Mathematically proficient students can explain correspondences between equations, verbal descriptions, tables, and graphs or draw diagrams of important features and relationships, graph data, and search for regularity or trends. Younger students might rely on using concrete objects or pictures to help conceptualize and solve a problem. Mathematically proficient students check their answers to problems using a different method, and they continually ask themselves, "Does this make sense?" They can understand the approaches of others to solving complex problems and identify correspondences between different approaches.


