52 results
High school statistics interactive notebooks for Google Apps
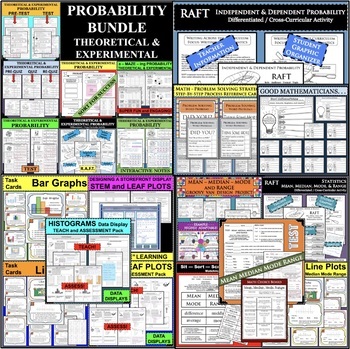
PROBABILITY AND STATISTICS MEGA GROWING BUNDLE of Activities PDF & GOOGLE SLIDES
A multitude of resources for PROBABILITY and STATISTICS! Engage your learners in fun, interactive, and differentiated ways. Hands-on learning opportunities for teaching, review, and assessment.Topics Included:DATA and GRAPHSMEAN, MEDIAN, MODE, RANGETHEORETICAL and EXPERIMENTAL PROBABILITYINDEPENDENT & DEPENDENT PROBABILITYEXTRA PRODUCTS TO DEVELOP DEEPER MATH UNDERSTANDING!These differentiated activities are NO PREP and READY TO GO! Great for sub (substitute lesson plans). They work wel
Subjects:
Grades:
4th - 9th
Scatter Plots and Linear Models Digital Notes
These scatter plots notes include both DIGITAL and PAPER notes. You will get links to Google Slides for digital and PDF for paper notes. These notes are designed to be used throughout a multi-day unit on scatter plot graphs and linear modeling.Included in resource:•“I Can” statements (2)•Background building activity•Notes Pages (2 Foldable notes)•Practice problems (2 pages)•Anchor Chart (Cheat Sheet)•Answer Key•Teacher’s GuideThese notes are perfect for math interactive notebooks. They take you
Subjects:
Grades:
8th - 9th
Also included in: Scatter Plots Activity Bundle
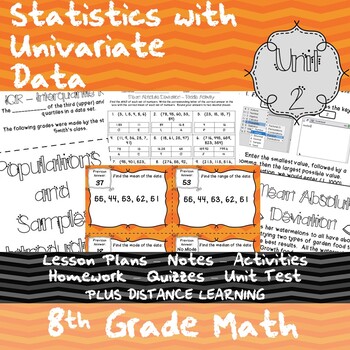
Statistics with Univariate Data - Unit 2 - 8th Grade + Distance Learning
Statistics with Univariate Data - Unit 2 - 8th Grade Math - CurriculumTHIS FILE NOW CONTAINS THE PDF VERSION OF THIS PRODUCT PLUS A GOOGLE SLIDES VERSION FOR DISTANCE LEARNINGThis bundle pack contains Lesson Plans, Notes, INB pages, Homework, Quizzes, Activities, Study Guide, and a Unit Test.Topics Covered:• Measures of Center• Mean Absolute Deviation• Populations and Samples• Random Samples• Generating Random Samples with TechnologyMain Features:★ Lesson Plans - Includes daily vocabulary, I wil
Subjects:
Grades:
7th - 9th
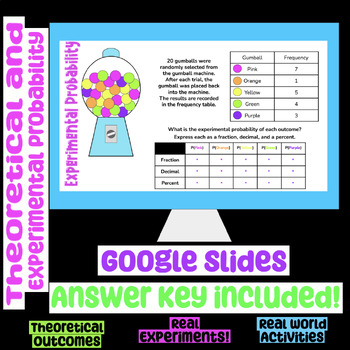
Theoretical and Experimental Probability Google Slides Digital Notes
Students learn how to calculate theoretical and experimental probability.Includes formulas and several examples of theoretical and experimental probability including dice, playing cards, and a real working spinner!Includes guided notes and drag and drop activities! Would make a great introduction or review in any math classroom! Would make a great addition to a digital interactive notebook! Answer key included. Digital learning friendly!
Subjects:
Grades:
6th - 9th
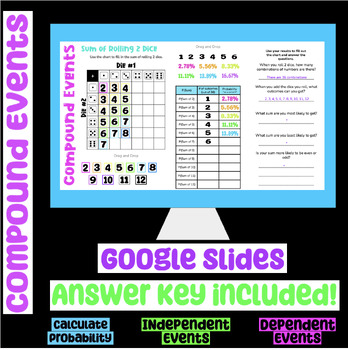
Calculating Probability of Compound Events Google Slides Digital Notes/Activity
Students learn how to calculate probability of independent and dependent compound events.Includes formulas and several examples of calculating probability of compound independent and dependent events. Includes calculations using sum of 2 dice, a gumball machine, playing cards, and a spinner!Includes guided notes and drag and drop activities! Would make a great introduction or review in any math classroom! Would make a great addition to a digital interactive notebook! Answer key included. Di
Subjects:
Grades:
6th - 9th
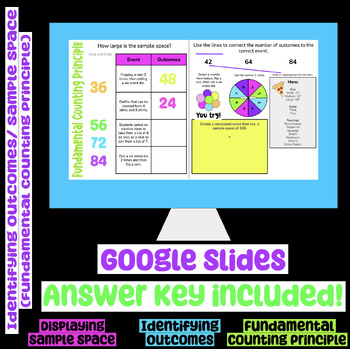
Identifying Outcomes/Sample Space (Fundamental Counting Principle) Google Slides
Students learn the basics of probability by identifying outcomes of statistical questions using the fundamental counting principle.Includes rules of probability, identifying outcomes, fundamental counting principle, and creating tree diagrams and tables to display sample space.Includes guided notes and drag and drop activities! Would make a great introduction or review in any math classroom! Would make a great addition to a digital interactive notebook! Answer key included. Digital learning fr
Subjects:
Grades:
6th - 9th
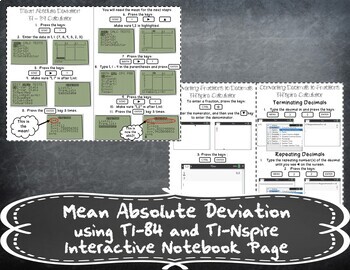
Mean Absolute Deviation using a Calculator Handout Notes (TI-84 and TI-Nspire)
Mean Absolute Deviation using a Calculator Handout Notes (TI-84 and TI-Nspire)THIS FILE NOW CONTAINS THE PDF VERSION OF THIS PRODUCT PLUS A GOOGLE SLIDES VERSION FOR DISTANCE LEARNINGTHIS PRODUCT IS NOW INCLUDED IN Statistics with Univariate Data - Unit 2 - 8th Grade-Notes + Distance Learning Bundle!This product contains a handout notes page for Mean Absolute Deviation using the TI-84 Calculator and TI-Nspire Calculator.This product includes:- Link to mp4 Video Notes- Embedded Video Notes in Goo
Subjects:
Grades:
8th - 9th
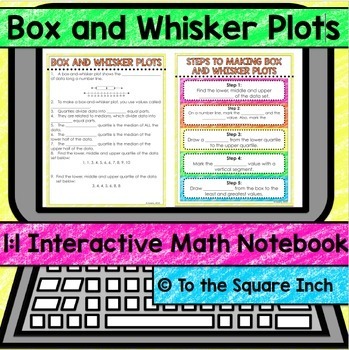
Box Plot Digital Interactive Math Notebook
Box and Whisker Plot 1:1 Interactive Math NotebookAre you looking for a way to engage your math students in a 1:1 device environment? Check out my line of 1:1 Interactive Math Notebooks! Included in this product: -Box and Whisker Plot Guided Notes-Steps to Making Box and Whisker Plot Guided Notes-Box and Whisker Plot Practice-Box and Whisker Plot Double Dice Practice-Answer Keys*Please note that the download includes a link to the product and a tutorial for teacher use. This product is best used
Subjects:
Grades:
7th - 9th
Types:
CCSS:
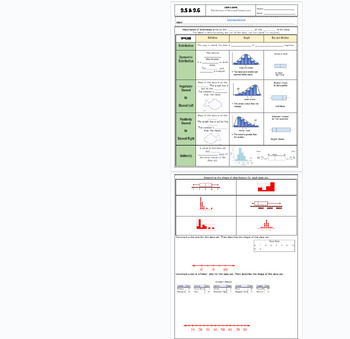
Data Distribution positive/negative skewed fillable notes UPDATED
Unit 9: Data and Stats: Updated(No 9.3/ Skip)9.5/9.6 Data Distribution (skewness)Students go over the vocabulary and complete the examples with the vocabulary scaffolded. Skewness is explained and how to identify it comparing data charts and box and whisker plots. Uses many visuals and examples to differentiate between that different graphs. Notes are scaffolded. Includes hook video hyperlinked on the "learning objective" title. Key is included and hyperlinked as a PDF in the heading highlighted
Subjects:
Grades:
6th - 12th, Higher Education, Adult Education
CCSS:
Also included in: Unit 9: Data and Statistics Fillable Notes
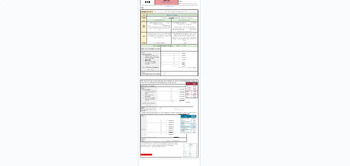
Standard Deviation Fillable Notes UPDATED
Unit 9: Data and Stats: Updated(No 9.3/ Skip)9.4 B Standard DeviationStudents go over the vocabulary and complete the examples with the vocabulary scaffolded. Standard deviation is long hand calculated by showing each step of the process (difference of squares). Real-world examples are explained in notes before calculating to show the importance of this stat and why it is used so often to verify valuable and effective data. Notes are scaffolded. Includes hook video hyperlinked on the "learning o
Subjects:
Grades:
7th - 12th, Higher Education, Adult Education
CCSS:
Also included in: Unit 9: Data and Statistics Fillable Notes
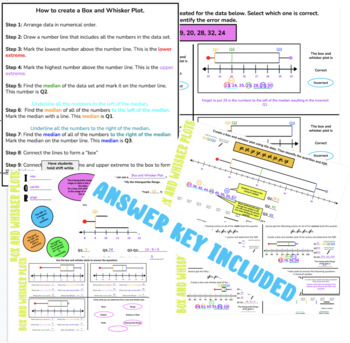
Box and Whisker Plots, Quartiles, and IQR Google Slides
Students learn how to create box and whisker plots as well as identify quartiles and IQR. Includes color coded steps for creation with drag and drop parts, several examples to create, word problems, and answering questions based on a box and whisker plot. Also includes a slide of identifying what is wrong with the creation of a box and whisker plots designed for advanced learners! Includes guided notes and practice problems! Would make a great introduction or review in any math classroom! Wou
Subjects:
Grades:
6th - 10th
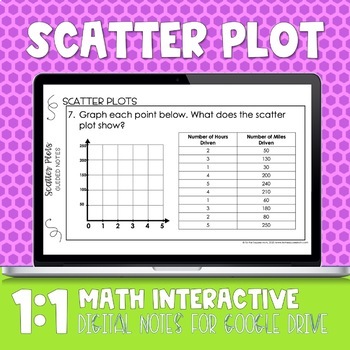
Scatter Plot Digital Notes
Scatter Plot Digital NotesThis product is a Google Slides product- students can complete notes and practice digitally. Included in this product: -Guided Notes and guided practice-Practice Problems-Vocabulary Models-2 warm-ups-2 exit slips-1 page with Google Tools Shortcuts for student use-Answer KeysCheck out my other Distance Learning Digital Products Here
Subjects:
Grades:
7th - 9th
CCSS:
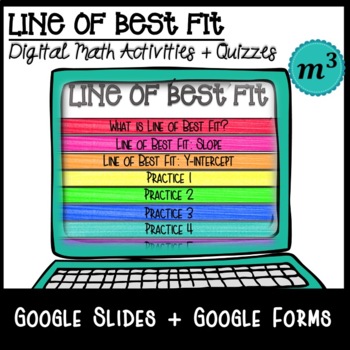
Line of Best Fit_DIGITAL NOTES & 2 QUIZZES (GOOGLE)(Distance Learning)
Product Description Google Slides Digital Interactive Notes. The notes are everything beneficial of an interactive notebook without all the paper, glue, scissors, etc. Content: Students will be able to draw a line of best fit. Students will be able to use a line of best fit to determine slope and y-intercept. Includes: Google Slides: Line of Best Fit Digital Notes Google Forms: Self Grading Quick Check Quiz 1 & Self Grading Quick Check Quiz 2 Answer Key Teacher Edition includedResource you
Subjects:
Grades:
8th - 9th
Types:
Also included in: 8th Grade Math Digital Notes GROWING BUNDLE (Distance Learning)
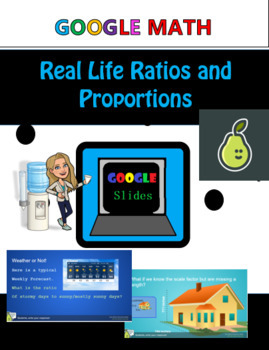
Pear Deck Ratios and Proportions in Real Life Google Lesson
Pear Deck is fantastic for Google Classroom and Distance Learning Reviews:- Looking at data sets- Setting up and understanding the parts of ratios- Reducing ratios- Understanding Scale Factor- Set up Ratios- Covert Scale Factors from fractions to decimals and vice versa- Look at real world examples embedded in the lesson to connect with real numbers
Subjects:
Grades:
4th - 12th, Higher Education
Types:
Also included in: Summer School Pear Deck Geometry Google Activity Bundle Digital NO PREP
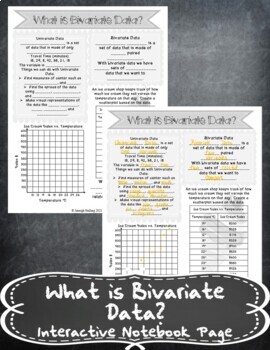
What is Bivariate Data? Notes Handout + Distance Learning
What is Bivariate Data? Notes HandoutTHIS FILE NOW CONTAINS THE PDF VERSION OF THIS PRODUCT PLUS A GOOGLE SLIDES VERSION FOR DISTANCE LEARNINGThis handout covers:- Univariate Data Review- Bivariate Data Introduction- Creating a ScatterplotThis product includes:- Pictures of the finished foldable in my INB- Link to mp4 Video Notes- Embedded Video Notes in Google Slides FileAnswer keys are included and will print in a way where they can be used for students with accomodations such as copy of class
Subjects:
Grades:
8th - 9th
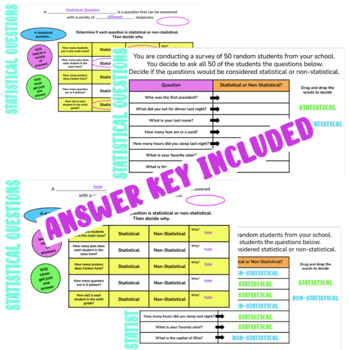
Statistical Questions Google Slides
Students learn how to identify a statistical and a non-statistical question. Includes several examples with justification and a drag and drop activity to test ability to identify. Includes guided notes and explanations. Would make a great introduction or review in any math classroom! Would make a great addition to a digital interactive notebook! Answer key included. Digital learning friendly!
Subjects:
Grades:
5th - 10th
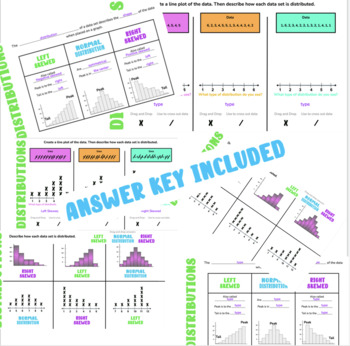
Distributions Google Slides
Students learn how to determine if a data set is skewed left, right, or a normal distribution. Includes several sets of data for identification and an activity where students create a line plot and determine the distribution. Includes guided notes, drag and drop dots and x's for creating graphs, and explanations along with several practice graphs. Would make a great introduction or review in any math classroom! Would make a great addition to a digital interactive notebook! Answer key includ
Subjects:
Grades:
6th - 10th
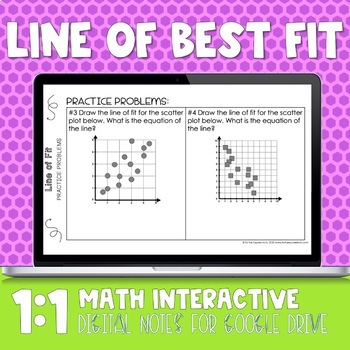
Line of Best Fit Digital Notes
Line of Best Fit Digital NotesThis product is a Google Slides product- students can complete notes and practice digitally. Included in this product: -Guided Notes and guided practice-Practice Problems-Vocabulary Models-2 warm-ups-2 exit slips-1 page with Google Tools Shortcuts for student use-Answer KeysCheck out my other Distance Learning Digital Products Here
Subjects:
Grades:
7th - 9th
CCSS:

Survey Project - Digital Google Slides Assignment
This project requires students to:- Create a numerical and categorical statistical question- Predict and hypothesis the results they will receive- Think about how they will set up and send out their survey- Survey 25 individuals and interpret their results. - Calculate Mean and Standard Deviation- Create charts on Google Sheets- Discuss results- Discuss possible improvementsThis project could take up to a week for students to complete depending on how you set it up in your classroom.One thing yo
Subjects:
Grades:
7th - 12th
CCSS:
Probability - EDITABLE Warm-Ups, Slides, INB & Test+++ Drive Math
Drive Instruction with instructional resources that live in the cloud on Google Drive! All of the docs are COMPLETELY EDITABLE and can be differentiated to meet your needs or the needs of your students. PDFs are also included in the download if you prefer them that way. Each Drive Instruction set includes warm-ups, exit tickets, notes, presentations, digital interactive notebooks and tests. These are designed to be complementary to all of my innovative supplemental resources and an improvement o
Subjects:
Grades:
6th - 10th
Also included in: Probability & Expected Value Unit Bundle - Distance Learning Compatible
Histogram & Line Plots - EDITABLE Slides, INB & Tests+++ Drive Math
Drive Instruction with instructional resources that live in the cloud on Google Drive! All of the docs are COMPLETELY EDITABLE and can be differentiated to meet your needs or the needs of your students. PDFs are also included in the download if you prefer them that way. Each Drive Instruction set includes warm-ups, exit tickets, notes, presentations, digital interactive notebooks and tests. These are designed to be complementary to all of my innovative supplemental resources and an improvement o
Subjects:
Grades:
6th - 9th
CCSS:
Also included in: Complete Pre-Algebra - EDITABLE Slides / INB/ Warm-Ups / Notes / Test+++
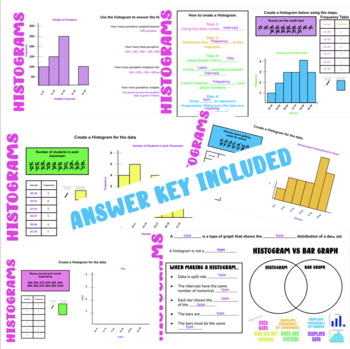
Histograms- Google Slides
Students learn how to create histograms. Includes steps for creation, frequency charts, examples to create with drag and drop bars, word problems, and comparing and contrasting to bar graphs. Includes guided notes, practice problems where students identify intervals, track frequencies, and create histograms! Would make a great introduction or review in any math classroom! Would make a great addition to a digital interactive notebook! Answer key included. Digital learning friendly!
Subjects:
Grades:
6th - 10th
Measures of Center - EDITABLE Slides, Notes, INB & Test+++ Drive Math
Drive Instruction with instructional resources that live in the cloud on Google Drive! All of the docs are COMPLETELY EDITABLE and can be differentiated to meet your needs or the needs of your students. PDFs are also included in the download if you prefer them that way. Each Drive Instruction set includes warm-ups, exit tickets, notes, presentations, digital interactive notebooks and tests. These are designed to be complementary to all of my innovative supplemental resources and an improvement o
Subjects:
Grades:
6th - 10th
Also included in: Measures of Center & Variance Unit Bundle - Distance Learning Compatible
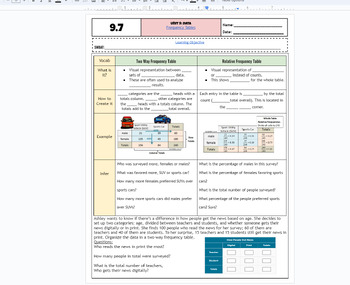
Frequency Tables & Relative Frequency Tables fillable notes UPDATED
Unit 9: Data and Stats: Updated(No 9.3/ Skip)9.7 Frequency Tables Students go over the vocabulary and complete the examples with the vocabulary scaffolded. Students examine a categorical table/frequency table and also use that information to create relative frequency tables. Different real-world examples and problems are used. Emphasized how percents and decimals are calculated. Notes are scaffolded. Includes hook video hyperlinked on the "learning objective" title. Key is included and hyperli
Subjects:
Grades:
6th - 12th, Higher Education, Adult Education
CCSS:
Also included in: Unit 9: Data and Statistics Fillable Notes
Showing 1-24 of 52 results


