20 results
High school statistics research for Google Apps

Scatter Plot and Bivariate Data Research Project
Students will begin a statistics project on one of their favorite restaurants or food chains! They will be researching nutrition facts and surveying others on what types of food they like to eat there. Through this data collection they will work on their skills of creating scatter plot graphs, creating relative frequency tables, and analyzing this data. This can be used either by paper or digitally. I used it the last two years during distance learning. Rubric included.
Subjects:
Grades:
7th - 12th
Types:
Scatter Plot Project on Desmos with Template
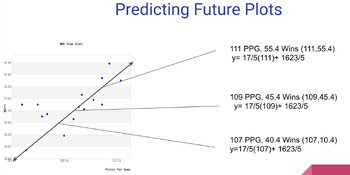
Learners will work to collect their own data from something they are interested in. They will then create a scatter plot using Desmos.com and analyze the information they collected. The analysis includes drawing their own trend line, finding the equation of that trend line, and predicting 3 values outside their original data collection. There are detailed directions with screenshots included along with a Google Slides template that can be shared with learners to help them organize their work. I
Subjects:
Grades:
7th - 9th
Types:
Crime Rate Analysis Assignment
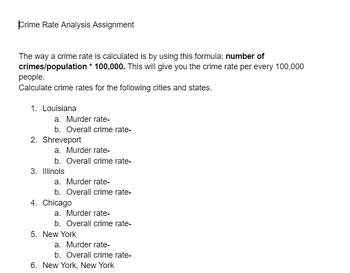
A web based assignment to allow students to calculate the crime rates of various U.S. cities.
Grades:
5th - 12th, Higher Education, Adult Education
Types:
March Madness Statistics Project
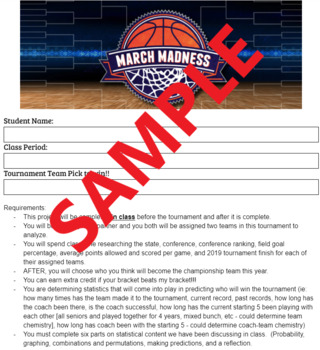
High School and Middle School Statistics Class Project. March Madness is played by an estimated 25 to 30 million people each year and in this project our students will be part of the action! Don't worry, if you don't know one thing about basketball you will do fine with this project! Each student will become an researcher and pick two teams to win the tournament! Requirements:This project will be completed in class before the tournament and after it is complete.You will be able to pick a partne
Subjects:
Grades:
9th - 12th, Higher Education
Types:
Analyzing and Interpreting Quantitative Data Assessment
This product contains a set of 26 multiple-choice questions focused on quantitative data analysis. It is designed for educators, researchers, and students who want to test their knowledge or prepare for exams in this field.Each question is structured to test the reader's understanding of a specific aspect of quantitative data analysis. The questions cover a range of topics, including statistical software selection, data cleaning, missing data, hypothesis testing, and effect size.The questions ar
Subjects:
Grades:
11th - 12th, Higher Education, Adult Education
Types:
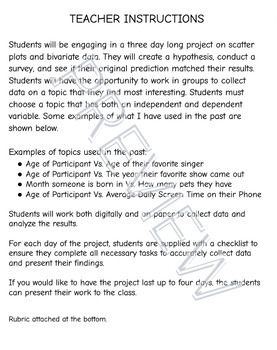
Scatter Plot and Bivariate Data Project
Students will be engaging in a three day long project on scatter plots and bivariate data. They will create a hypothesis, conduct a survey, and see if their original prediction matched their results. Students will have the opportunity to work in groups to collect data on a topic that they find most interesting. Rubric attached at the bottom.
Subjects:
Grades:
6th - 12th
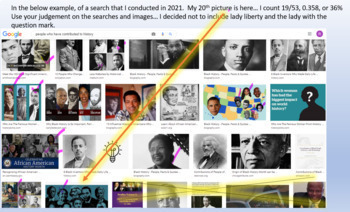
Women's History Month Probability Project
Students learn about suffrage and representatio of women. Students conduct Google searches on favorite subject, sport/hobby, future career and find the probability of a woman appearing in the first 20 images. Students make conjectures about representation of women in those areas. Students identify women they admire and create a video summarizing their findings.Can be adapted to images for African Americans for Black History Month, Hispanic Americans for Hispanic Heritage Month, etc.
Subjects:
Grades:
6th - 12th, Adult Education, Staff
TEST: Quantitative Data Collection - Sampling, Instruments, and Analysis
This test is designed to evaluate your understanding of key concepts related to quantitative data collection. It consists of 17 multiple-choice questions that cover a range of topics, including sampling procedures, instrument selection, and data analysis.The test begins by assessing your knowledge of unit of analysis, permissions required before beginning a study, and different types of populations and sampling procedures. It then moves on to explore the best sampling procedures to use in differ
Subjects:
Grades:
11th - 12th, Higher Education
Types:
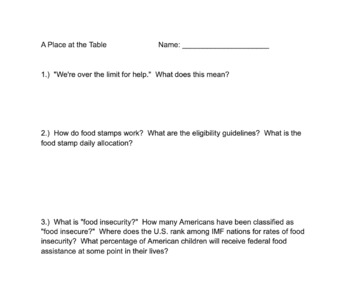
U.S. Food Policy: A Place at the Table Viewer's Guide
This is a set of discussion questions to accompany the 2012 documentary film A Place at the Table (rentable on Amazon.) The documentary covers a wide range of basic, relevant facts about the history of food insecurity, food policy, and the impact of hunger on income and class mobility in the United States. These easily accessible questions set up base knowledge in students so that they are able to tackle two technical journal articles quantifying the impact of government programs addressing hung
Subjects:
Grades:
9th - 12th
Types:

Statistics 1st Quarter Research Project
In this document, you'll find detailed instructions and grading rubrics for a data collection, organization, and presentation report based project. This is a google doc that will be added to your google drive when you purchase and will be fully editable to customize to your classroom needs. Students will: 1. learn to write an abstract, 2. describe the nature of their data, 3. choose, implement, and describe a sampling method, 4. discuss possible errors, 5. calculate mean, median, mode, midrange,
Subjects:
Grades:
11th - 12th, Higher Education
Types:
Significance Test for Pi Project
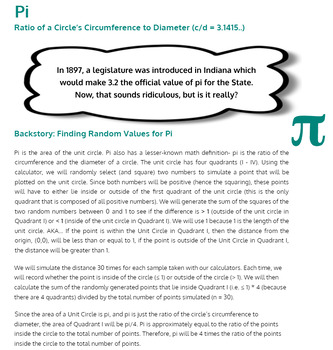
This project is designed for an AP Statistics class that has learned about a 1-sample t test using TI-Nspire calculators. During this project, students will explore how to create a simulated pi value using a TI-Nspire calculator to answer a series of inference questions for means using simple, step-by-step instructions. Students will be expected to know how to run a 1 Sample t Test for means. After students complete the test, they will complete a series of questions using the results from their
Subjects:
Grades:
10th - 12th
Types:

3 Day Global Issues Project
This three day project is designed to get students thinking about global issues. I have each student choose a different topic. Day 1 they are researching the topic, looking at statistics and sources. Day 2 they are digging deeper and creating a tv commercial. Day 3 they should prep their slides, using the rubric included on how you will grade it. Included: - 3 Days of prompts - 2 Grading Rubrics
Subjects:
Grades:
9th - 12th
Types:

Statistics Probability Report Project
In this document, you'll find detailed instructions and grading rubrics for a probability based project which includes the design and creation of a unique game, the testing of that game, and the calculation of various probabilities resulting from the game. This is a google doc that will be added to your google drive when you purchase and will be fully editable to customize to your classroom needs. Students will: 1. learn to write an abstract, 2. create and write instructions for a unique game, 3
Subjects:
Grades:
11th - 12th, Higher Education

Statistics Hypothesis Testing Research Project
In this document, you'll find detailed instructions and grading rubrics for a hypothesis testing research project and report. This is a google doc that will be added to your google drive when you purchase and will be fully editable to customize to your classroom needs. Students will: 1. learn to write an abstract, 2. determine null and alternative hypotheses, 3. choose, implement, and describe a sampling method and experimental design, 4. discuss possible errors, 5. calculate a confidence interv
Subjects:
Grades:
11th - 12th, Higher Education
Types:
Reader's Guide: Food Insufficiency, Family Income, and Health..."
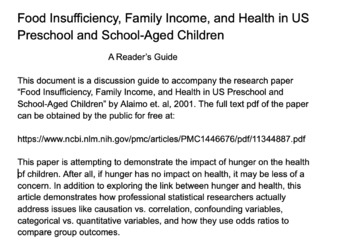
This document is a discussion guide to accompany the research paper “Food Insufficiency, Family Income, and Health in US Preschool and School-Aged Children” by Alaimo et. al, 2001. The full text pdf of the paper can be obtained by the public for free at: https://www.ncbi.nlm.nih.gov/pmc/articles/PMC1446676/pdf/11344887.pdfThis paper is attempting to demonstrate the impact of hunger on the health of children. After all, if hunger has no impact on health, it may be less of a concern. In addition t
Subjects:
Grades:
9th - 12th
Types:
CCSS:
3D Editable Radial Diagram - Google Slide and Google Sheet files
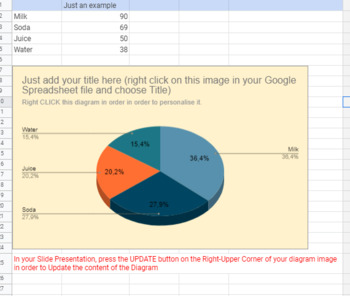
With this 3D Editable Radial Diagram you can easily prepare your diagram presentations and you can use them in almost any activity. Be creative!Useful for any teacher that wants to explain and demonstrate what is a diagram, why and when people are using it. Radial Diagrams help you and your students visualize the results, learn fractions, etc.This is an editable Radial Diagram. You will get 1 Google Spreadsheet File and 1 Google Slide file. You will edit all the data in the Spreadsheet and you w
Subjects:
Grades:
1st - 12th, Higher Education, Adult Education, Staff
Editable Double Column Chart Diagram for Digital Learning - Google Slide
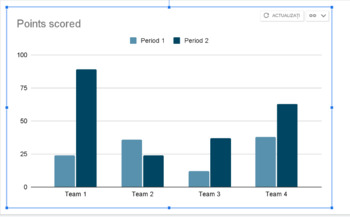
With this Editable Double Column Chart Diagram for Digital Learning you can easily prepare your column chart diagram presentations and you can use them in almost any activity. Be creative!Useful for any teacher that wants to explain and demonstrate what is a column chart diagram, why and when people are using it. Column chart Diagrams help you and your students visualize the results, read diagram charts, etc.This is an editable Column Chart Diagram. You will get 1 Google Spreadsheet File and 1 G
Subjects:
Grades:
1st - 12th, Higher Education, Adult Education, Staff
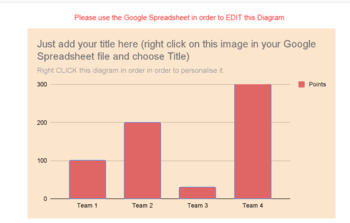
Editable Chart Diagram - One Column - for Digital Learning - Google Slide
With this Editable One Column Chart Diagram for Digital Learning you can easily prepare your column chart diagram presentations and you can use them in almost any activity. Be creative!Useful for any teacher that wants to explain and demonstrate what is a column chart diagram, why and when people are using it.Column chart Diagrams help you and your students visualize the results, read diagram charts, etc. Very helpful for math activities and statistics.This is an editable Column Chart Diagram. Y
Subjects:
Grades:
1st - 12th, Higher Education, Adult Education, Staff
Types:
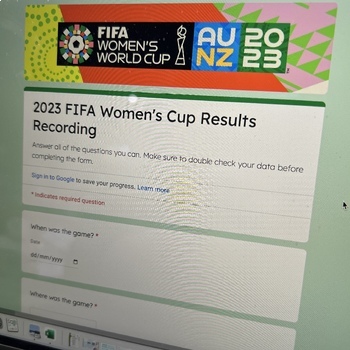
2023 FIFA Women's World Cup Data Recording Google Form
Let's celebrate the FIFA Women's World Cup and engage students in gathering data. This Google Form gathers:- Game results- Attendance at the game/Ticket sales- Goals- Attempted goals- Cards- Why cards were givenUse this data to further Statistical Investigation skills and support rich real-world Maths learning. This is designed to work with the 2023 FIFA Women's World Cup Data Recording Google Form, 2023 FIFA Women's World Cup Data Recording Template and 2023 FIFA Women's World Cup Goal Line Gra
Subjects:
Grades:
2nd - 12th
Types:

Distance Learning Physics Self Paced Home Projects
Contains lesson plans for high school level students in a stay at home or distance learning setting to conduct a major project over the course of 1-2 weeks (60 minutes per day). The projects are self-paced with sufficient instructions without any additional work by the teacher (or parent). Three projects in a variety of STEM areas are included as described below.1. Solar System Exploration Research and Design Project2. Data Visualization Design Project (Tableau)3. Homemade Face Mask DIY Maker P
Subjects:
Grades:
9th - 12th
NGSS:
HS-ESS1-4
, HS-ETS1-2
, HS-ETS1-3
, HS-ETS1-1
, HS-ETS1-4
Showing 1-20 of 20 results


