6 results
High school statistics assessments for Microsoft Excel
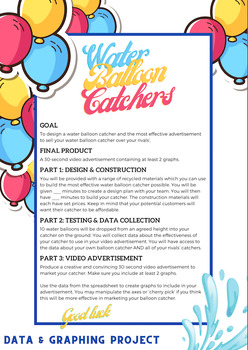
Water Balloon Catcher Project - Data and Graphing - Mathematics
Transform your maths classroom into a dynamic hub of learning with this captivating data and graphing project! Designed for upper primary/middle school students, this hands-on and inquiry-based activity ensures an immersive experience in mastering data interpretation, chart creation, and understanding the role of data and graphs in advertising.In this engaging project, students will: Explore Data: Collaborate in teams to design and construct a Water Balloon Catcher using recycled materials, each
Subjects:
Grades:
5th - 9th
Types:

AP Statistics 1st Semester Bundle (EXAMVIEW)
Over 1,000 total questions covering all the topics in the 1st semester of AP Statistics. -Graphical Displays-Means and Distributions-Experimental and Sampling Design-Linear Regression-Discrete Distributions-Continuous Distributions-ProbabilityIncluding a separate review bank!Keys includedAll .bnk examview filesTHIS IS AN EXAMVIEW (.BNK) format. This will only open if you have the Examview Assessment Suite Software. It will not open with a word processor. Please do not purchase unless you have t
Subjects:
Grades:
9th - 12th
Types:
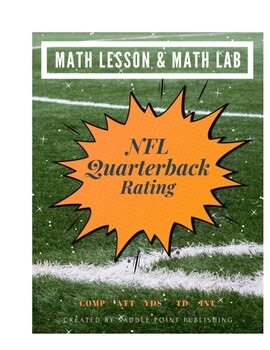
MATH LESSON & MATH LAB on NFL Quarterback Rating
Most people have heard of professional football and the NFL but few people know that there is an actual formula used to calculate ratings for the NFL quarterbacks! This is a tried and true math lesson and lab that I have created and used for many years with my 7th and 8th grade classes. Students get a "kick" out of learning about the actual formula used by the NFL to calculate passer ratings for the quarterbacks. They learn some history about when the rating of quarterbacks first started, anal
Subjects:
Grades:
6th - 10th, Adult Education
Types:
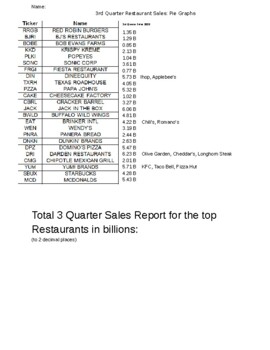
Business Statistics Graphing Project
After studying statistics in business and pie graphs, this is great culminating project. Students graph information for the 3rd quarter restaurant sales in the United States, for 2020, the middle of the pandemic. They will graph, research, and think about owning a business during uncertain times.
Subjects:
Grades:
11th - 12th
Types:
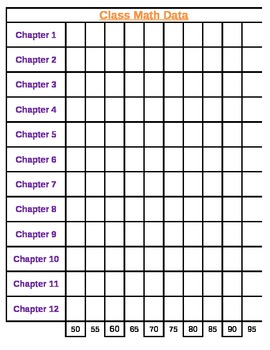
Math Class Data Sheet
Great for a class Data Wall!
This is an excel spreadsheet used to track yearly growth.
Enjoy!
Subjects:
Grades:
K - 12th
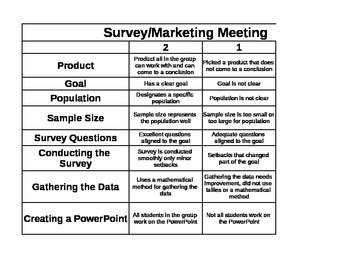
Survey/Marketing Meeting Rubric
This is a rubric I use for an end of unit project on statistics. Students work in groups, select a product they want to improve, create a survey, conduct the survey, analyze the data collected to market a new (improved) product. Students create a powere point or prezi to hold a marketing meeting for the class. Key Terms: sample size, population.
Subjects:
Grades:
6th - 9th
Types:
Showing 1-6 of 6 results


