52 results
High school statistics printables for Google Apps
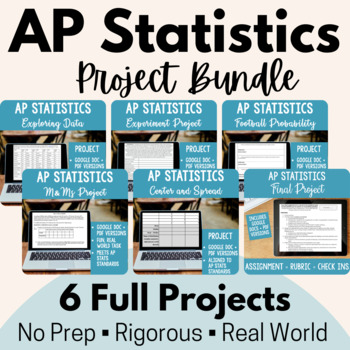
AP Statistics Project Bundle! 6 Projects + digital versions
Looking for some engaging, real-world projects to liven up your AP Statistics course? Need new materials that are ready for remote/ online learning? Want to make sure your AP Statistics course properly prepares student for the AP exam? Look no further - this bundle is for you! In this bundle, you will find four of my popular AP Statistics projects -- all updated to include EDITABLE google docs to assign to students as well as PDFs for printing, if you prefer. All projects also include a complete
Subjects:
Grades:
10th - 12th
Types:
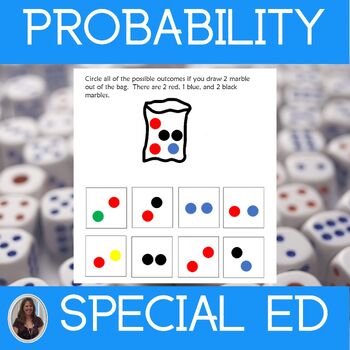
Chance & Probability Math Worksheets Special Education Statistics & Probability
This unit on Chance and Probability contains printable and digital math worksheets for special education. This statistics and probability unit is for students who take alternate assessments.This Chance and Probability unit helps students understand how to determine the probability of an event and all its possible outcomes. The worksheets, which use pictures and color coding, are differentiated. There are many ways for students to practice these skills in this unit that are at different levels.
Subjects:
Grades:
7th - 9th
Statistics Curriculum Statistics and Probability Special Ed Math Curriculum
Save $$$ with this Statistics Curriculum. This special ed math curriculum contains 8 units from my series on statistics including statistics and probability. They were developed for students with autism and special learning needs in middle and high school. Each unit is structured in the same way with similar content to enable your students to make connections and build on what they learn in each unit. This repetition of format helps ease anxiety and free up mental space when learning more di
Subjects:
Grades:
8th - 10th
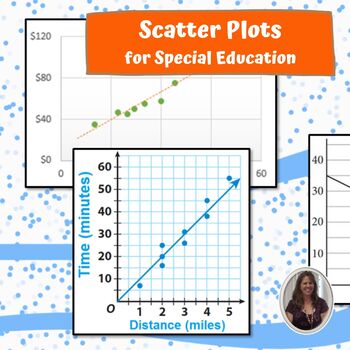
Scatter Plots for Special Education PRINT AND DIGITAL
This unit on Scatter Plots has almost 200 pages and 72 slides of material specifically designed for students with special learning needs, especially autism who are in middle and high school. This unit focuses on helping students interpret and read scatter plots. There are differentiated versions of the worksheets that use pictures and color coding. There are many, many worksheet for students to practice in this unit that are at different levels. There are MANY opportunities for students to e
Subjects:
Grades:
8th - 10th
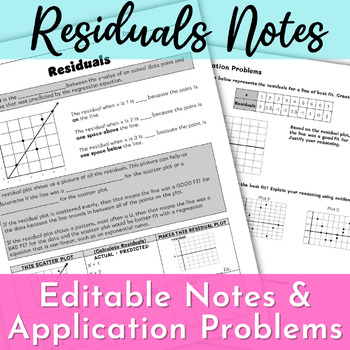
Residuals and Residual Plots for Regression Guided Notes
Students discover the connection between residual plots and assessing the fit of the linear regression with these simple notes. Students then apply their understanding to application problems that require higher order thinking.Included:PDF versionEditable Google Doc versionAnswer KeyDon't forget to leave a review so you can earn TPT credit!
Subjects:
Grades:
8th - 9th
Types:
CCSS:
Also included in: Regression Unit Bundle
Central Tendency: Mean, Median, and Mode for Special Ed PRINT AND DIGITAL
This unit on Central Tendency has almost 200 pages of material specifically designed for students with special learning needs, especially autism who are in middle and high school. This unit mainly focuses on helping students identify the mean, median, and mode of data sets, surveys, and graphs. There are differentiated versions that use pictures and color-coding. Students will also practice identifying graphs that have a normal distribution. Finally, there are some worksheets where students
Subjects:
Grades:
8th - 10th
Types:
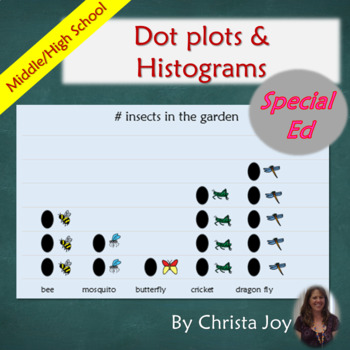
Dot plots and histograms for Special Education PRINT AND DIGITAL
This unit on dot plots and histograms has over 100 pages and 52 google slides of material specifically designed for students with special learning needs, especially autism who are in middle and high school. This unit mainly focuses on helping students understand, create, and interpret these two ways of displaying data. There are differentiated versions that use pictures and color-coding. There are also hands-on activities to give students practice creating their own dot plots with manipulativ
Subjects:
Grades:
8th - 10th
Types:
Grade 8 Ontario Math - Probability Assessments - PDF + Google Slides
This resource is for the Grade 8 DATA strand of Probability. ***This resource is meant to be used with my Grade 8 Probability digital unit but can also be used separately.*** Do you need summative assessments for the NEW Ontario Math Curriculum? This NO-PREP, PDF and editable resource is what you need! This resource contains summative assessments for your students to apply what they have learned in the Data strand. This package contains 2 assessments: a Mid-Chapter Quiz and a Unit Test. The ass
Subjects:
Grades:
7th - 9th
Types:
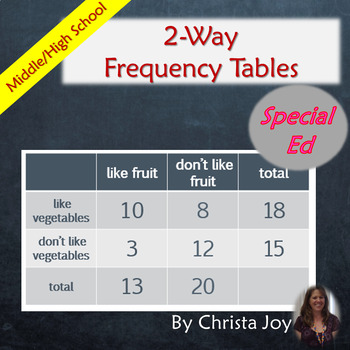
2-Way Frequency Tables for Special Education PRINT AND DIGITAL
This unit on 2-Way Frequency Tables has almost 200 pages and 76 google slides of material specifically designed for students with special learning needs, especially autism who are in middle and high school. This unit focuses on helping students interpret, read, and create 2-Way Frequency Tables as well as Venn Diagrams. There are differentiated versions of the worksheets that use pictures and color-coding. There are many, many worksheet for students to practice in this unit that are at differ
Subjects:
Grades:
8th - 10th
Independent Dependent Probability Puzzle (Digital/PDF)
This download includes both a PDF and digital Google Slides version of this activity.Use this hexagon puzzle to add some variety to your lessons!DIGITAL: Use the link to access a Google Slides version of this resource. Students will arrange the movable puzzle pieces to match questions to answers. A page for showing work is included.PDF: Cut the 12 puzzle pieces apart, then paste them into place so that each question matches its answer.Students will calculate the probability of independent and de
Subjects:
Grades:
6th - 9th
Types:
Box and Whisker Plots for Special Education PRINT AND DIGITAL
This unit on Box and Whisker Plots has 100 pages and 30 slides of material specifically designed for students with special learning needs, especially autism who are in middle and high school. This unit focuses on helping students interpret and read box and whisker plots. There are differentiated versions of the worksheets that use pictures and color-coding. There are many opportunities for students to engage in repeated information on learning about what you can learn from box and whisker plo
Subjects:
Grades:
9th - 11th
Surveys Creating and Conducting for Special Education PRINT AND DIGITAL
This unit on Surveys has almost 200 pages and 56 googles slides of material specifically designed for students with special learning needs, especially autism who are in middle and high school. This unit focuses on helping students understand what makes a good survey, how to give one, and how to understand and present the results. There are differentiated versions of the worksheets that use pictures and color-coding. There are lots of ways for students to practice these skills in this unit tha
Subjects:
Grades:
9th - 11th
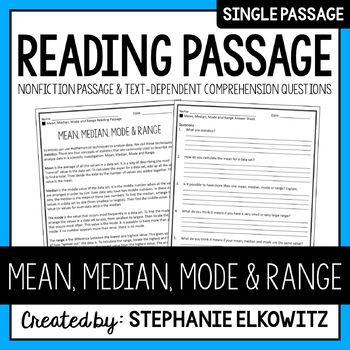
Mean, Median, Mode and Range Reading Passage | Printable & Digital
About this Product• This is a SINGLE, nonfiction reading passage with text-based comprehension questions.• Five comprehension questions probe lower, mid and higher order thinking.• The passage can be used for close reading, one-on-one intervention, homework or sub work.• The passage can be used as a "prelab" to introduce students to the topic(s) of a SNAPs lab.• Answer key included.**Download FREE Reading Passages to learn more about my reading passages**Important Note:This reading passage is fr
Subjects:
Grades:
5th - 10th
Types:
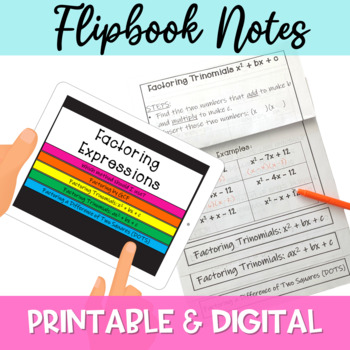
Factoring Notes Flipbook Digital and Printable for Algebra 1
This product contains flipbook notes for Factoring in Algebra 1. There are FOUR VERSIONS included with LITTLE OR NO PREP, READY-TO-USE THIS MINUTE!Topics included:Flowchart: a flowchart to help students select the appropriate strategyFactoring by GCFFactoring Trinomials x^2+bx+cFactoring Trinomials ax^2+bx+c: Three versions included - blank, Slide and Divide; AC MethodFactoring Difference of Two SquaresFOUR VERSIONS:Digital completed flipbook for use with Google Slides - great option for student
Subjects:
Grades:
7th - 9th
Types:
CCSS:
Also included in: Algebra 1 Factoring Unit Bundle of Digital and Printable Activities!
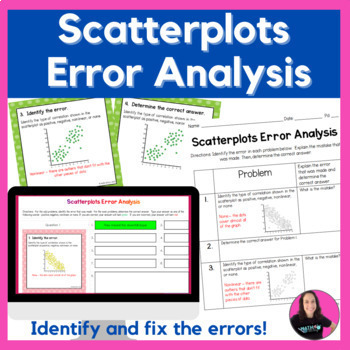
Scatterplots Error Analysis Digital and Printable Activity
In this 8th grade error analysis activity, students will identify mistakes when working with scatterplots and bivariate data. Students will need to know when the correlation is positive, negative, nonlinear, or if there is no correlation. Students will use a digital drop down menu to see each task card and complete the problems. They will receive immediate feedback if they completed the problem correctly.The same problems are also provided on the printable version, so that students can write
Subjects:
Grades:
7th - 9th
Types:
CCSS:
Also included in: 8th Grade Math Error Analysis Digital and Printable Activities VOLUME 2
7th Grade Big Ideas Math Chapter 8 Quizzes and Test-Common Core/MRL Ed-Editable
Howdy, Update November 2023: I have added an editable Google Doc Version of the file.Are you using 7th Grade Big Ideas Math? Here are some great quizzes and a test for you. I have written two quizzes and a test for Chapter 8 – 2019 Common Core/Modeling Real Life Edition. There are lots of questions completely aligned to most summative tests. This is a no prep product. The questions are carefully crafted, and the pages are formatted for easy correcting. You will get great data and information
Subjects:
Grades:
7th - 9th
Types:
Also included in: 7th Big Ideas Math All Chapters Quizzes and Tests Bundle - Editable
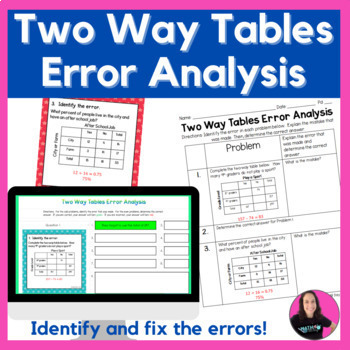
Two Way Tables Error Analysis Digital and Printable Activity
In this 8th grade error analysis activity, students will identify mistakes when working with two way tables and bivariate data. Students will need to know how to complete a table, as well as find the percent of a number from data in the table. Also, they will need to know what the term relative frequency means.Students will use a digital drop down menu to see each task card and complete the problems. They will receive immediate feedback if they completed the problem correctly.The same proble
Subjects:
Grades:
7th - 9th
Types:
CCSS:
Also included in: 8th Grade Math Error Analysis Digital and Printable Activities VOLUME 2
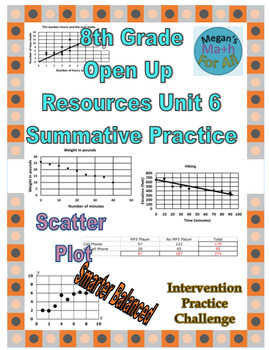
8th Grade Open Up Resources Unit 6 Math Summative Practice - Editable - SBAC
Howdy,Update December 2020: You asked for it and here they come: Digitally Interactive too.This product has math practice in four formats: editable Word Document, link to editable Google Document, standard PDF, and Digitally INTERACTIVE PDF. Are you using Open Up Resources 8th Grade Units authored by Illustrative Mathematics®? Here is a set of questions you can use for summative practice for unit 6. I used the content of the unit and matched it to Smarter Balanced Item Specs (SBAC). This will he
Subjects:
Grades:
8th - 9th
Types:
Also included in: 8th Grade Open Up Resources All Unit Summative Practice - Editable
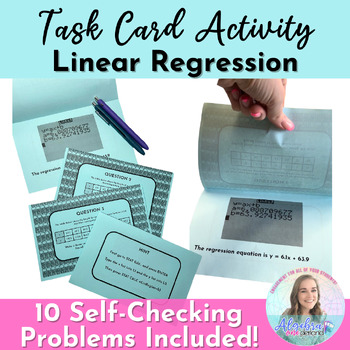
Linear Regression Task Card Activity for Algebra 1
These linear regression task card tents are set up to help your students be more independent in their practice. Includes 10 task cards problems requiring students to use their calculator to complete a linear regression and write a linear regression equation.They are set up to be self-checking and little prep!Format:Questions are on the frontA hint is on the backAnd the answer is insideEasy Prep: Print the ten cards double-sided and fold - then you're done!
Subjects:
Grades:
8th - 9th
Types:
CCSS:
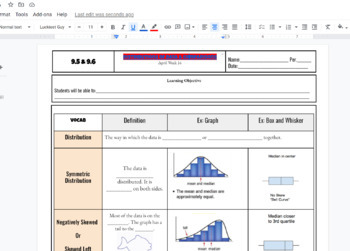
Distributions of Data Scaffolded Fillable Notes (Skewed Left & right) w/ KEY
Distributions of Data Scaffolded Fillable Notes (Skewed Left & right) Includes a problem of creating box plot, bar chart, and dot plot. KEY IS INCLUDED linked at top of title highlighted in red!!! , Algebra 1 or Math 1 class in highschool setting IEP 504 EL learners visuals for better understanding. YOU CAN EDIT THE GOOGLE DOC to your liking!!!
Subjects:
Grades:
7th - 12th, Higher Education, Adult Education
CCSS:
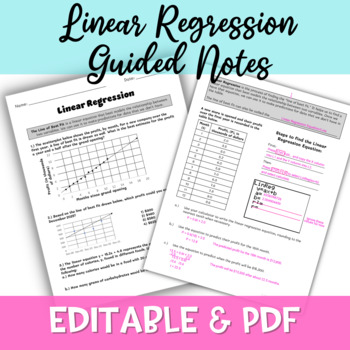
Linear Regression Guided Notes for Algebra 1
Linear regression does not need to be confusing! These guided notes are intended for use with for your Algebra 1 students, or as a refresher for other courses. These quick printable guided notes (PDF Format) make it seamless and develop deeper understanding. Editable version for use with Google Forms is also included. Answer Key included.Don't forget to leave a review so you can earn TPT credit!
Subjects:
Grades:
8th - 9th
Types:
CCSS:
Also included in: Regression Unit Bundle
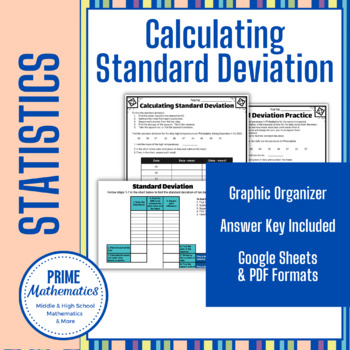
Calculating Standard Deviation Graphic Organizer
Use this graphic organizer to teach students the process of finding the standard deviation of a data set. In addition to the pdf, a self-checking Google Sheet is also included. The data sets from the pdf can be used in the Google Sheet or you can use any data set of ten items (and it still checks each step of the process). This product includes:a Graphic Organizer worksheet pdf with two sets of data and a blank versionan answer key for the Graphic Organizer worksheet pdfa self-checking Google Sh
Subjects:
Grades:
6th - 12th
CCSS:
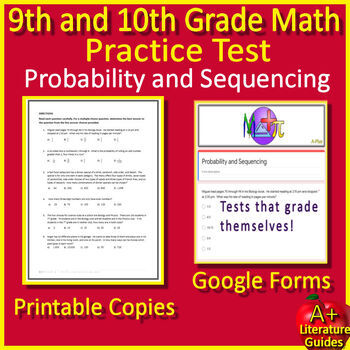
9th and 10th Grade NWEA Map Math Practice Test - Probability and Statistics Prep
9th and 10th Grade NWEA Map Math Practice Test - Probability and Statistics Test Prep - Includes 20 multiple choice questions. It is completely printable, but also comes as self-grading Google forms. Includes:20 Printable Questions and Answers Self-Grading Google Link with directions for sharing in Google Classroom Why am I qualified to write these questions? Not only have I worked as a teacher for 30 years with a Highly Qualified Status, but I also have spent 15 years writing state and natio
Subjects:
Grades:
8th - 11th, Higher Education
Types:
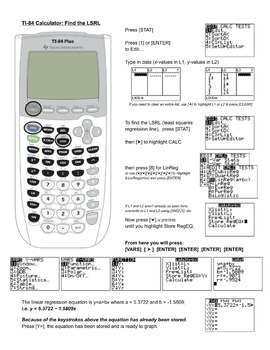
Find LSRL and Graph LSRL and Scatter Plot on TI-84 Calculator
This is a step-by-step handout for students to learn to find and graph a Least Squares Regression Line on the Ti-84 Graphing Calculator.The handout includes images from the TI-84.This handout is the 2nd of a series. See "Enter Data in TI-84 Calculator to Find 1-Var Statistics" for the 1st handout I would have students use.Because Statistics often prefers y=a+bx, that form is reference in the Google Doc. However, if you prefer to use the form y=ax+b, it would be a simple edit to change the "8:L
Subjects:
Grades:
10th - 12th, Higher Education
Types:
CCSS:
Showing 1-24 of 52 results


