41 results
High school statistics assessments for Microsoft PowerPoint
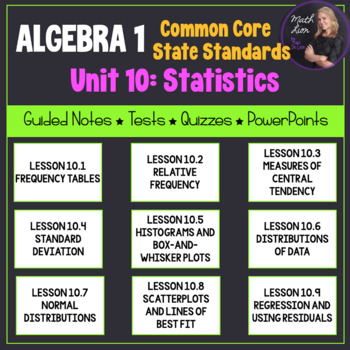
Statistics (Algebra 1 Curriculum - Unit 10) | Bundle for Common Core
This is a great unit that covers a Statistics unit in an Algebra 1 course! 9 lessons are included!All documents are EDITABLE!Included:- Overview of the common core alignment (PDF)- Guided notes for 9 lessons (PDF and Word)- PowerPoints that coordinate with the guided notes (PPTX)- Mid-Unit Quiz (PDF and Word)- Unit Test (PDF and Word)-Pacing Guide (PDF and Word)Each lesson contains a learning scale, warm up (do-now or bell ringer), key concepts, vocabulary, and examples for students to follow w
Subjects:
Grades:
7th - 12th
CCSS:
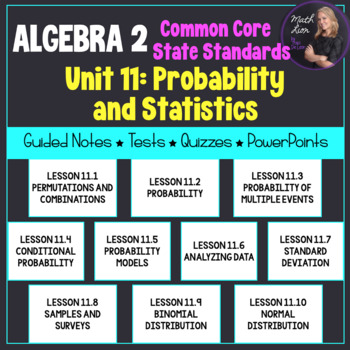
Probability and Statistics (Algebra 2 - Unit 11) | Math Lion
Documents are editable!!! This unit includes PowerPoint presentations, coordinated guided notes with answers, a mid-unit quiz, and unit test covering Probability and Statistics Functions. The PowerPoint includes warm ups (do-now or bell ringer), key concepts, and examples for students to follow. 10 lessons included! The lessons are 30 - 45 minutes each. 11.1: PERMUTATIONS AND COMBINATIONS 11.2: PROBABILITY 11.3: PROBABILITY OF MULTIPLE EVENTS 11.4: CONDITIONAL PROBABILITY 11.5: PROBABILITY MODEL
Subjects:
Grades:
9th - 12th
CCSS:
Also included in: Algebra 2 Unit Plans 9-12 (Bundled) | Math Lion
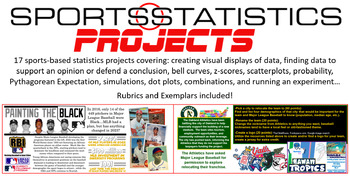
Sports Statistics - Projects ONLY! 17 projects in all
Most of the projects allow students to choose their own topic to display their understanding of statistical topics. Students will:Create a graph of their choosing given dataDesign an infographic on the subject of their choosingResearch and defend their G.O.A.T. choice in a variety of categoriesUse demographics to relocate and rebrand a professional franchiseResearch social injustices in sports and display the dataCreate a bell curve based on career statistics of Michael JordanCompare the salari
Subjects:
Grades:
8th - 12th
CCSS:

IB Psychology Internal Assessment (IA) Analysis and Statistics Slides
Walk your students through the Analysis section of the Internal Assessment (IA). Google slides include content and background information on statistics, directions and links for students to follow while they write their Analysis section, create their table and graph, and run descriptive statistics and inferential statistics with their raw data. Includes links to online calculators for mean, standard deviation, Mann Whitney U Test, Wilcoxon Test. Analysis rubric and links to two IA exemplars incl
Subjects:
Grades:
9th - 11th, Higher Education, Adult Education

Grade 9 Geography STRAND D: Changing Populations Unit Bundle
This STRAND D: Changing Populations Bundle is a perfect fourth unit for Grade 9 Canadian Geography and includes over 100 slides of content, one quiz, and two bonus assessment activities! The bundle includes 6 products total. Answer keys are include for all quizzes and assessments. Content includes: Population trends in Canada, Immigration Trends in Canada, and Population Characteristics!! Bonus content includes 12 Kahoot Links to use as a study tool. Play as a class or students can challenge the
Subjects:
Grades:
7th - 10th
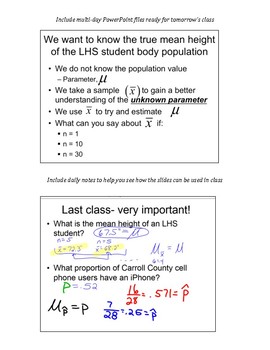
AP Statistics Stats Sampling Distributions Central Limit Theorem CLT tests keys
This is a large unit covering all things with sampling distributions. This includes three multi day powerpoint files, many handouts, two quizzes, a test (and answer keys).
The answer keys for handouts, tests and quizzes are included. I've also included my daily class notes so you can see how the powerpoint files can be used in class.
Subjects:
Grades:
10th - 12th, Higher Education

Probability Bundle - PowerPoint, HW, Quizzes with Answer Keys
This bundle contains all the probability work I have posted from my Probability & Statistics course, including the answer keys that go along with it.
Subjects:
Grades:
10th - 12th, Higher Education
CCSS:

Probability Bundle - PowerPoint, HW, Quizzes
This bundle contains all the probability work I have posted from my Probability & Statistics course.
Subjects:
Grades:
10th - 12th, Higher Education
CCSS:
Probability and Statistics Unit D Statistical Experimenting Powerpoint Lecture
Probability and Statistics Unit D Statistical Experimenting Powerpoint Lecture
Subjects:
Grades:
9th - 12th
Types:
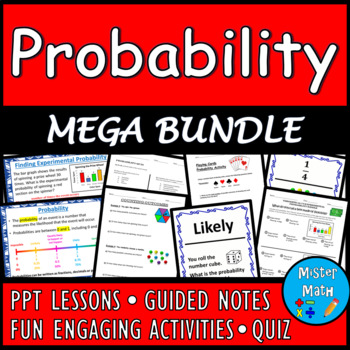
Probability MEGA BUNDLE
This Probability MEGA BUNDLE is just what you've been looking for to assist students in learning about likelihood, simple probability, and experimental/theoretical probability! Included in this bundle, you will find:Outcomes & Events PowerPoint LessonOutcomes & Events Guided Notes (coincides with PowerPoint Lesson)Simple Probability PowerPoint LessonSimple Probability Guided Notes (coincides with PowerPoint Lesson)Simple Probability Riddle ActivitySimple Probability Scavenger HuntTheoret
Subjects:
Grades:
6th - 9th
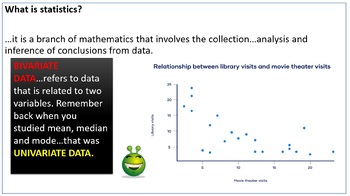
Bivariate Statistics Scatter Diagram Guide for Grade 8/9/10
This resource is a complete guide to Bivariate Data & Scatter diagrams This resource contains the various Statistics terminolgy, together with multiple examples. The methodology on how to construct scatter diagrams and interpret them has been outlined. Additionally, the various types of correlation has also been covered. This resource can be used as a lesson plan in the classroom, questions can be used as homework and even as a Summative/Formative. You Choose!Kind Regards ENTER-ONE
Subjects:
Grades:
8th - 10th
Types:
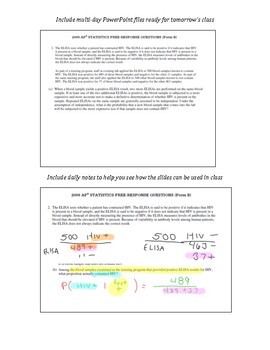
AP Statistics Stats Probability Unit COMPLETE handouts, tests, keys, notes
This is a multi-chapter unit covering all things regarding probability. Each chapter contains daily powerpoint files, handouts, quizzes, tests, and daily notes. This includes the following sub units: ($37 when purchased separately)
General Probability
Discrete and Continuous Random Variables
Binomial and Geometric Distributions
Sampling Distributions
The answer keys for handouts, tests and quizzes are included. I've also included my daily class notes so you can see how the powerpoint files ca
Subjects:
Grades:
10th - 12th, Higher Education
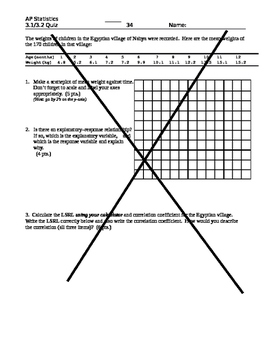
AP Stats Statistics Linear Regressions, LSRL, Correlation,Variation, test & keys
This is a large unit covering all things with linear regressions. This includes three multi day powerpoint files, two quizzes, a test (and a make-up test), a Geometer's SketchPad file that demonstrates the LSRL and what it looks like, and a worksheet walking students through an AP-style problem.
The answer keys for tests and quizzes are included. I've also included my daily class notes so you can see how the powerpoint files can be used in class.
Subjects:
Grades:
10th - 12th, Higher Education
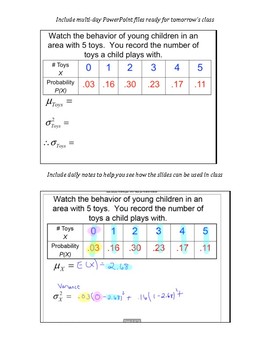
AP Statistics Stats Discrete Continuous Random Vars Tests Quizzes keys notes
This is a large unit covering all things with random variables (both discrete and continuous). This includes three multi day powerpoint files, two quizzes, two versions of a test, and a make-up test.
The answer keys for tests and quizzes are included. I've also included my daily class notes so you can see how the powerpoint files can be used in class.
Subjects:
Grades:
10th - 12th, Higher Education
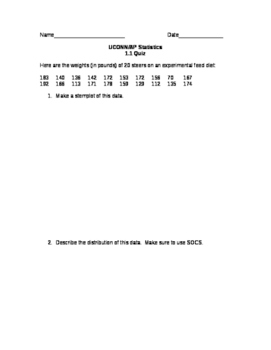
Statistics: Graphical Displays of Data and Measures of Central Tendency
This zip file contains 14 documents; 3 PowerPoints, 2 warm-ups, 7 practice worksheets, a quiz, and a test for the end of the unit. The content in this unit focuses on all graphical displays of categorical and quantitative data including pie charts, histograms, bar graphs, boxplots, stem and leaf, split stem plots, and ogives. Students learn how to create and interpret all graphs. They learn about skew, and distribution. This unit also includes all measures of central tendency such as mean, med
Subjects:
Grades:
9th - 12th
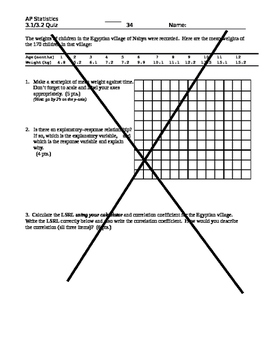
AP Stats Statistics Unit Bundle (Exploring Data) 4 Chapters, tests quizzes keys
This unit bundle contains all the materials I have posted for Exploring Data (cost $38 individually). This unit is called Exploring Data and includes:
Ch 1: Displaying and Describing Data
Ch 2: Standard Normal Calculations
Ch 3: Least Square Regression Lines
Ch 4: Nonlinear data and transformations
Each chapter includes powerpoints, quizzes, tests, and other activities. You can see these items in more details in my other products for AP Statistics.
The answer keys for tests and quizzes are inc
Subjects:
Grades:
10th - 12th, Higher Education
Confidence Intervals with Proportions Unit
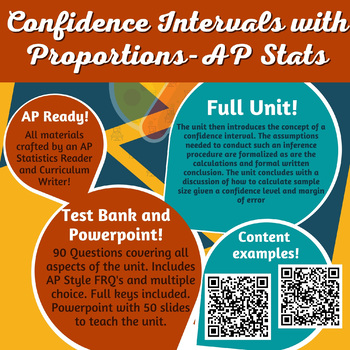
This unit introduces the topic of a sampling distribution. We discuss the properties of sampling distributions and how the sample size will affect the shape and variation of the distribution, as well as how that would then affect calculated probabilities within that distribution. Examples of how to calculate those probabilities from tables and also using technology are shown. The unit then introduces the concept of a confidence interval. The assumptions needed to conduct such an inference proced
Subjects:
Grades:
9th - 12th
AP Statistics: Discrete Distributions: Full Unit
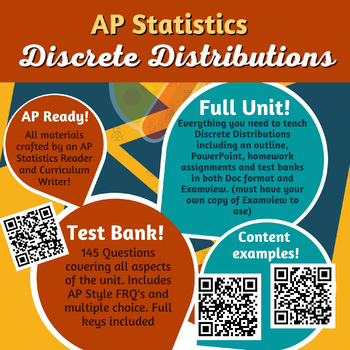
This is a complete unit over Discrete Distributions for the AP Statistics Course. This bundle includes a Topic Outline, describing suggested pacing and content. There is a 62 slide PowerPoint that covers all related material including descriptions of how to correctly answer FRQ's. The unit covers basic discrete tables, binomial, geometric and fair game questions. There are 9 different assignments for the unit, consisting of original questions. Tired of students just CHEGG-ing the answers? Proble
Subjects:
Grades:
9th - 12th
AP Statistics Stats Binomial Geometric Dist handouts,tests, quizzes, keys, notes
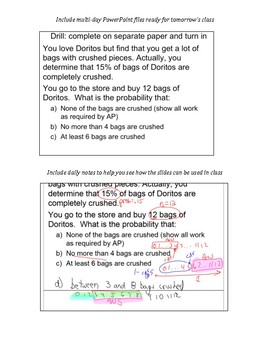
This is a large unit covering all things with binomial and geometric distributions. This includes three multi day powerpoint files, several handouts for extra practice, a quiz, two versions of the test.
The answer keys for handouts, tests, and quizzes are included. I've also included my daily class notes so you can see how the powerpoint files can be used in class.
Subjects:
Grades:
10th - 12th, Higher Education
Standard Deviation and Interquartile Range Bundle (distance learning)
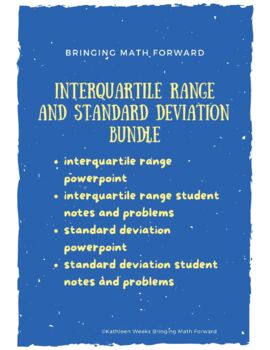
Finding standard deviation and interquartile range can be challenging for students. The presentations and the notes in this bundle break down the processes with step by step instructions. The bundle combines two powerpoints to explain how to find both standard deviation and IQR and two documents with students notes on finding both with and without a graphing calculator as well as student problems on both processes.
Subjects:
Grades:
7th - 10th

AP Statistics Stats Describe Display Distributions with tests,quizzes,keys,notes
This chapter covers all things with displaying and describing distributions. From box plots, stem plots, histograms, and dot plots to shapes (skewed or symmetrical) and calculating outliers, this covers it all. This includes two multi-day powerpoint lessons with many answers in the notes fields as well as a quiz (two versions) and a test (two versions). All tests and quizzes come complete with answer keys.
This also includes modified AP Statistics questions for review.
I've also included the a
Subjects:
Grades:
10th - 12th, Higher Education
CCSS:

Statistics:Sample Distributions of Means and Proportions
This unit is for a level 1/AP Statistics class. There are 2 powerpoints, 2 quizzes, 1 test review, 1 unit test, 4 warmups,and 10 activities/worksheets for practice. One activity is a scavenger hunt with stations that each have a word problem where students have to find the answer on another station somewhere else in the room. This activity makes a great unit review. The order of the unit is: an introduction to sampling distribution, then sampling distribution of means of a distribution, and
Subjects:
Grades:
9th - 12th
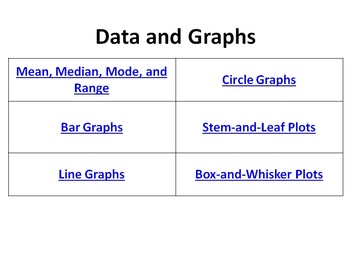
Data and Graphs Bell Ringers Bar Line Circle Stem-and-Leaf Box-and-Whisker Plots
Note: If you have already purchased the “Bell Ringers Decimals Fractions Graphs Geometry Integers Equations Inequalities” PowerPoint, please do not purchase this one, because this PowerPoint is included in that one. If you are interested in the Data and Graphs Bell Ringers and other Bell Ringer PowerPoints, please check out “Bell Ringers Decimals Fractions Graphs Geometry Integers Equations Inequalities.” You’ll receive all 87 Bell Ringers for a discount.
This 38-slide PowerPoint has 6 Bell
Subjects:
Grades:
5th - 9th
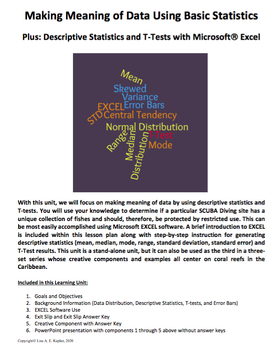
Making Meaning of Data Using Basic Statistics – Plus Statistics with EXCEL
This learning unit includes two files – a PDF document and a PowerPoint presentation. The PDF includes the following components and can be used solely by the teacher or modified to remove the assessment pieces and distributed to the students. 1. Goals and Objectives2. Background Information a. Data Distribution, Descriptive Statistics, T-tests, and Error Barsb. EXCEL Software Use3. Assessmentsa. Exit Slip and Exit Slip Answer Keyb. Creative Component with Answer Key All of the background info
Subjects:
Grades:
7th - 10th
CCSS:
Showing 1-24 of 41 results


