540 results
High school statistics assessment pdfs
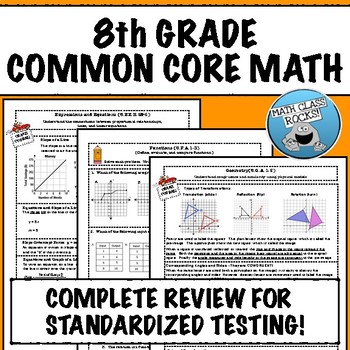
8TH GRADE MATH COMMON CORE REVIEW
If you need to prepare your students for a standardized test based on the Common Core, this “crash course” is exactly what you need! Organized by standard and easy to use, just print and let the reviewing begin! What's Included?This download consists of 10 “crash course” reviews with explanations and examples. Every "crash course" is followed by a practice assessment comprised of items aligned with standardized state tests. The Number SystemKnow that there are numbers that are not rational, a
Subjects:
Grades:
7th - 9th
Types:
Analyzing Plots, Graphs, and Tables using Measures of Central Tendency
This product provides students the opportunity to analyze data presented in different ways. By making calculations and analyzing data, students make conjectures and justify them using mathematical reasoning and evidence!What is included?This product contains 8 student work pages. Each work page contains a set of data displayed graphically with accompanying questions. The data displays included are 2 dot plots, 2 bar graphs, 2 frequency tables, and 2 stem-and-leaf plots. Students are required
Subjects:
Grades:
5th - 11th
Types:
![Preview of Statistics Final Exam and Review [AP, College, and Honors]](https://ecdn.teacherspayteachers.com/thumbitem/Statisticis-FinalReviewStudy-Guide-Exam-1711356723/original-699492-1.jpg)
Statistics Final Exam and Review [AP, College, and Honors]
You can use this Statistics Final Exam in an AP Statistics, Honors Statistics, or a College Statistics course as an assessment, review or both. What's Included?Included are 6 different versions, each including 60 well chosen representative questions in both multiple choice format and also in free response format*. These reviews and tests work well in class or as a take- home. The tests are editable with Adobe Acrobat Pro. Each test should take about 2 - 3 hours and can be taken with a graphin
Subjects:
Grades:
10th - 12th, Higher Education
Types:
CCSS:
Examining Effects of Outliers on Measures of Central Tendency
This 10-page document contains 3 real-life data sets. For each data set, students are guided through an exploration of how outliers in data affect mean, median, mode, and range. Each data set requires students to perform calculations and analyze data. Students will make conjectures and justify them in writing using mathematical reasoning and evidence.
At the end of the activity, students are asked several concluding questions that require them to analyze and evaluate their work. They focus
Subjects:
Grades:
5th - 9th
Types:
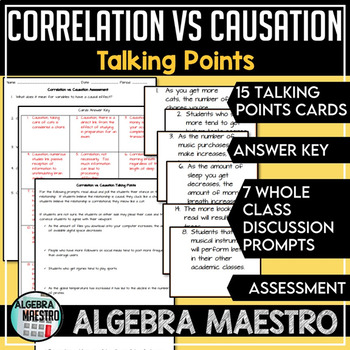
Correlation vs. Causation Talking Points, Prompt & Assessment
The Correlation vs. Causation Talking Points includes task cards, prompts to incorporate discussion, and an assessment. The task cards and assessment have answer keys attached with brief explanations. There are 15 task cards where students can work individually, pairs, or small groups identifying whether cards form a correlation or causation relationship. In the Talking Points, this is designed to be whole class where students take a side on what they believe a passage to be. The assessment
Subjects:
Grades:
5th - 12th
Types:
Middle School SBAC Math Performance Task (PT) Test Prep Bundle
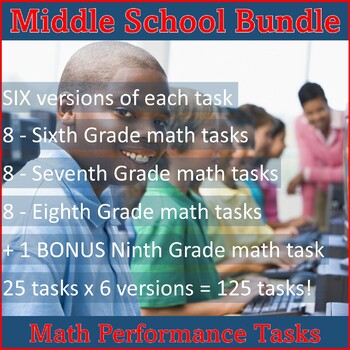
The purpose of the Middle School SBAC Performance Task Bundle is to familiarize students with math performance tasks in preparation for standardized testing. This bundle includes 26 tasks, with six versions of each task. Each task covers 6th, 7th, & 8th Grade Common Core Standards with a multitude of applications. You can use these as class activities, proficiency practice, or quizzes. These tasks provide excellent practice for STARR testing and other state exams. As a bonus for purchasing t
Subjects:
Grades:
6th - 9th
Types:
8th GRADE MATH: COMMON CORE REVIEW & PRACTICE TEST
If you need to prepare your students for a standardized test based on the Common Core, this “crash course” is exactly what you need!
When I realized that my students had to take the state test during the first week of April, I knew it would be impossible for me to cover all of the material to prepare them for the test! So, I created this review in the hope that it would, at the very least, familiarize them with concepts and help them to be successful! In addition, I created a complete practice
Subjects:
Grades:
7th - 9th
Types:
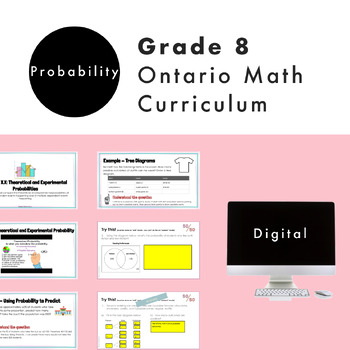
Grade 8 Ontario Math Probability Digital Google Slides + Form
Do you need a practical and engaging resource for the NEW Ontario Math Number strand? Are you planning for the NEW Grade 8 Ontario Math Curriculum? This editable Google Slide resource is what you need! This resource is for the Grade 8 DATA strand and covers specific expectations for “D2 Probability". In this resource, students will experience math through engaging real-life questions, storytelling through math, and interactive slides. What’s Included2 Google Slide presentations67 UNIQUE and ED
Subjects:
Grades:
7th - 9th
Types:
Also included in: Grade 8 NEW Ontario Math Curriculum Full Year Digital Slides Bundle
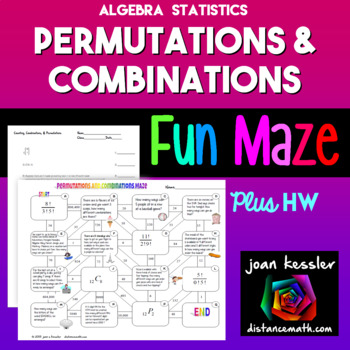
Combinations Permutations FUN Maze plus Quiz HW
This fun activity on Combinations, Permutations, and Counting can be used for Algebra or Statistics and will engage your students while reinforcing the concepts of permutations, combinations, and the counting principles. The different types of problems are placed randomly in the maze so that students must first decide the type of question before solving. The questions on the maze are letter coded so that if a student has a question, he or she can just ask about Question G, for example. There
Subjects:
Grades:
10th - 12th
Types:
CCSS:
Also included in: Algebra 1 Activity Bundle

Probability, Simple & Compound Task Cards
Probability, Simple & Compound Task Cards
This is a set of 24 task cards covering multiple representations of simple and compound probability. The questions are differentiated for a wide range of learners. These cards would be great for bell ringers, math stations, test prep, review, or just for fun!
What you get:
➸ 24 color task cards
➸ 24 black and white task cards
➸ Student answer sheet
➸ Key
You can laminate these and use them again and again. You could also hole punch each and keep
Subjects:
Grades:
5th - 9th
Types:
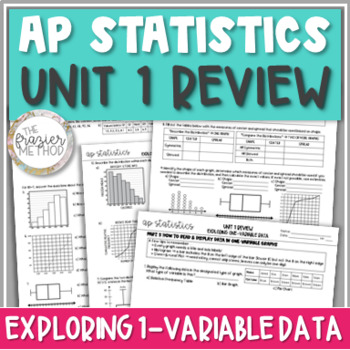
AP Statistics Review of Normal Distribution Histogram Box Plot Shape & Center
5 PAGES on histograms, boxplots, dot plots, stem-and-leaf, 5 number summary, percentiles, symmetric or skewed shape, median or mean for center, standard deviation or interquartile range for spread, outliers, Normal Distribution, z-scores, and more! This AP STATS EXAM REVIEW for Unit 1: Exploring One-Variable Data is great AP Stats Exam prep without the same old boring multiple choice problems or free response questions! Aligns with AP College Board’s updated 2019-2020 objectives and standards fo
Subjects:
Grades:
10th - 12th
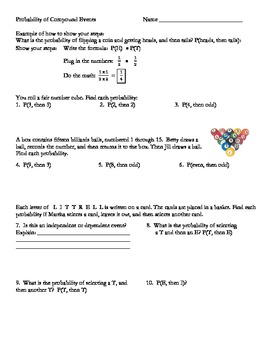
Probability: Compound Events (Independent and Dependent)
This 3 page document has a variety of compound event problems. It has built-in differentiation because the problems get progressively harder. There are even problems that combine independent and dependent events. There is an answer key.
Subjects:
Grades:
6th - 9th
Types:
Sports Statistics & Probability curriculum workbook (130+ pages) - Project-based
WATCH THE PREVIEW CLIP! E-MAIL ME FOR DISCOUNTS OR QUESTIONS AT MEDEIROSVINNY@YAHOO.COM.Looking to start an elective math class? Interested in project-based assessments?Tired of teaching statistics with no real-world application?This 132-page interactive workbook serves as a textbook for an introductory statistics math class; complete with Common Core standards crosswalk, embedded answers, and tons of activities and mini-projects. This workbook is the only resource I use for my 'Statistical R
Subjects:
Grades:
8th - 12th
Types:
CCSS:
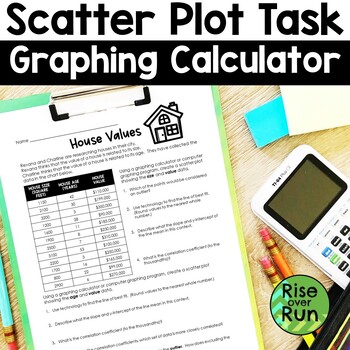
Scatter Plot Worksheet with Graphing Calculator Practice
Need a real world scatter plot activity where students use their graphing calculators? Grab this activity and help your students understand lines of best fit and calculating correlation coefficients!Students are given data on house sizes, house ages, and house values. They use a graphing calculator or computer program to plot the points and answer questions that follow.This is a great activity for partners to explore or for individual work. It can lead to some great math discussions!Answer key
Subjects:
Grades:
8th - 9th
Types:
CCSS:
Also included in: Algebra 1 and 8th Grade Math Curriculum Bundle for Entire Year
STATISTICS Unit Test CC Algebra 1
The Algebra I Common Core Unit Test will assess your students’ understanding of STATISTICS
Included topics:
Graphical Displays
Quartiles
Box Plots
Measures of Central Tendency
Variation
Two Way Frequency Tables
BiVariate Data
Linear Regression
Quantifying Predictability
Residuals
This assessment can serve as a test at the end of the unit, as a diagnostic tool prior to teaching the topics or as a “test prep” activity prior to state testing.
CCSS addressed:
N-Q.1
S-ID.1
S-ID.2
S-ID.3
S-ID.5
Subjects:
Grades:
9th - 12th
Types:
CCSS:
Also included in: Algebra 1 assessments - UNIT TEST BUNDLE
AP Statistics Review - Histogram, Box Plot, Stem-and-Leaf, Bar Graph, Pie Chart
REVIEW OF 1-1, 1-2, 1-3, 1-4, & 1-5 (1 Page, Front & Back)ANSWER KEY INCLUDEDProblems align with The Frazier Method’s Notes from Unit 1: Exploring One-Variable Data:Lesson 1-1: Categorical & Quantitative VariablesLesson 1-2: Displaying 1 Categorical Variable – Frequency Table, Bar Graph, Pie ChartLesson 1-3: Displaying 1 Quantitative Variable Part 1 – Dot Plot, Stem-and-Leaf Plot, HistogramLesson 1-4: Displaying 1 Quantitative Variable Part 2 – Cumulative Relative Frequency PlotLesso
Subjects:
Grades:
9th - 12th
Types:
Probability and Statistics Multiple Choice on Permutation and Combination
Grab this Worksheet! a 25 multiple choice questions on probability's Permutation and Combination that will enhance and gain student's understanding on the topic!you can have this as a quiz or as a practice exercises in your class! a must have!!Viva Math!
Subjects:
Grades:
9th - 12th, Higher Education, Adult Education
Types:
Bivariate Data Unit 8th Grade Math CCSS | Scatter Plots and Frequency Tables
This bivariate data unit includes notes, assessments, and stations. This is perfect for your students to dive into scatter plots, lines of best fit and two-way frequency tables. In-depth notes to teach and fun activities to supplement. Aligned to 8th grade math CCSSBy purchasing this bundle, you are saving more than 30% off the full value of the individual resourcesIncluded in this BundleAssessments: CCSS Aligned and Free ResponseScatter PlotsGuided NotesStationsGeometric Design Activity Google
Subjects:
Grades:
8th - 9th
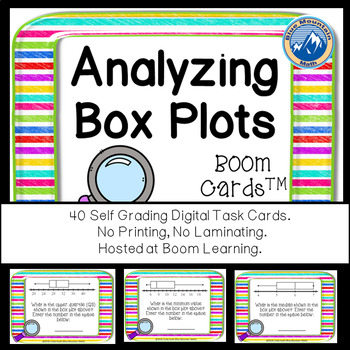
Analyzing Box Plots Boom Cards--Digital Task Cards
Boom Cards™ are a great way for students to practice skills analyzing Box Plots--formerly called Box and Whisker Plots. You can assess their understanding and students can play again to keep improving. This set uses a variety of different plots and asks question about lower quartile, upper quartile, median, interquartile range, range and outliers. This set of Boom Cards features 40 different Digital Self-Checking Task Cards. (No printing, cutting, laminating, or grading!)
Boom Cards live in the
Subjects:
Grades:
7th - 10th
Types:
CCSS:
Also included in: Algebra 1 Bundle Boom Cards--Digital Task Cards Distance Learning
Carnival Probability Project
In this multi-week project, students will design, create and play carnival games while finding the experimental and theoretical probability of the games. Students will present the final game at a carnival with a written report of what was learned throughout the process. This is a great end of the year activity for students.
Subjects:
Grades:
6th - 10th
Types:
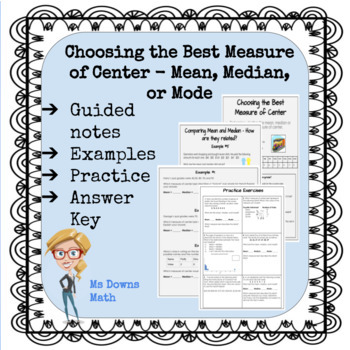
Choosing the Best Measure of Center - Mean, Median or Mode
This lesson is about how to choose which measure of center is best - Mean, Median, or Mode. I use this lesson in my Introduction to Statistics high school course.The guided lesson shows examples with skewed data and without. There is a practice (homework) assignment with 6 questions.An answer key to the entire lesson is provided as well.
Subjects:
Grades:
8th - 12th
Types:
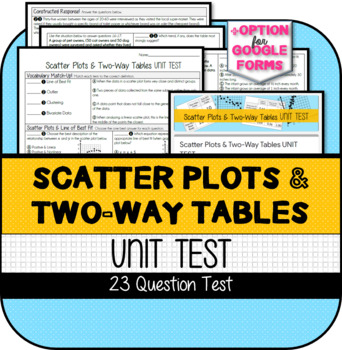
Scatter Plots & Two-Way Tables UNIT TEST (Printable & version for Google Forms)
This resource was developed to meet the requirements of the 8th Grade Statistics & Probability Standards below:CCSS.MATH.CONTENT.8.SP.A.1 Construct and interpret scatter plots for bivariate measurement data to investigate patterns of association between two quantities. Describe patterns such as clustering, outliers, positive or negative association, linear association, and nonlinear association.CCSS.MATH.CONTENT.8.SP.A.2 Know that straight lines are widely used to model relationships between
Subjects:
Grades:
7th - 9th
Types:
Also included in: Scatter Plots & Two-Way Tables UNIT BUNDLE
ACT Math Test Prep for Probability and Statistics
This ACT resource has 30 questions that cover statistics, probability, number sense, plug and chug, reading tables and charts, scientific notation and more! The answer key comes with explanations for each problem! Standards are included so student can determine weaknesses. You will have access to two versions: PDF and Easel. If you use Easel you will have a copy of the activity that has been digitized and is ready for students to fill in the answers. You can customize it further and then share w
Subjects:
Grades:
10th - 12th
Types:
Also included in: ACT Math Test Prep Bundle
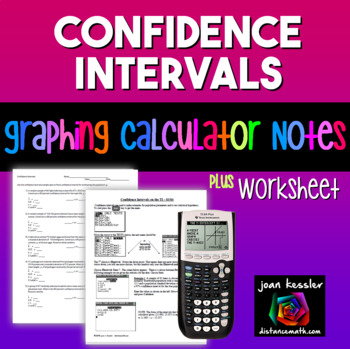
Statistics Confidence Intervals for the Mean TI 83 - 84 Reference Sheet plus HW
Confidence Intervals are not only part of AP Statistics and College Statistics, but are now included in Algebra 2 under Common Core. This resource helps students understand and succeed in determining confidence intervals to estimate a population mean using a TI 83 or TI 84 Graphing Calculator. Full step by step illustrated directions are given along with three examples.These notes can be used as Binder Notes or printed smaller for Interactive Notebooks.Also included is a handout with addition
Subjects:
Grades:
9th - 12th
CCSS:
Showing 1-24 of 540 results


