6 results
High school statistics lectures for Google Apps
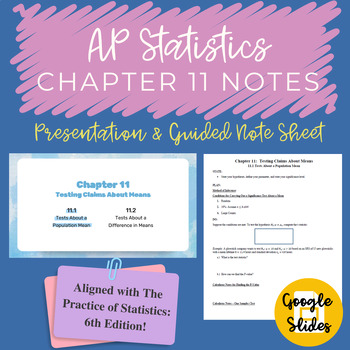
AP Statistics Chapter 11 Notes Google Slides and Guided Notes
Aligned with The Practice of Statistics (Sixth Edition); a presentation for the eleventh full chapter of AP Statistics (11.1 and 11.2 ), Testing Claims About Means. Includes: Tests About a Population Mean; and Tests About a Difference in Means. This file includes PowerPoint presentations for 11.1 and 11.2, along with their associated guided notes.This file is in Google Slides format for the presentation and a PDF of the notes. If you prefer PowerPoint, I have another file in my store that would
Subjects:
Grades:
10th - 12th
CCSS:
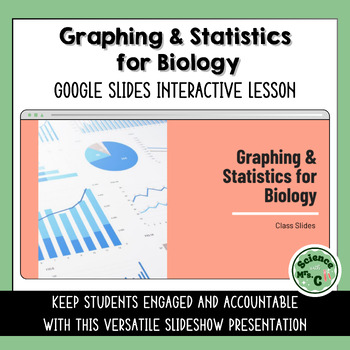
Graphing & Statistics for Biology Google Slides Lesson
Features a Google Slides lesson/presentation that reviews how to make scientific data tables, graph scientific data, and calculate mean, median, mode, and range.The topics covered in this presentation include:Identifying types of DataConstructing Data TablesCalculating Mean, Median, Mode, Range & Standard DeviationPlotting a GraphInterpolation & Extrapolation of DataKeep your students engaged and accountable with this interactive, versatile presentation. Embedded within these 27 colorful
Subjects:
Grades:
6th - 12th
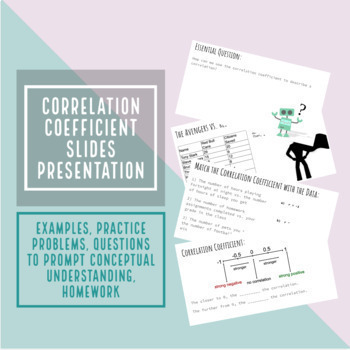
Correlation Coefficient Lesson Slideshow Presentation
Lesson explaining what the correlation coefficient means, how to identify it, and how to use it to describe data. Slideshow includes 15 slides with practice problems, a word problem, and a homework assignment. Answers to practice problems are in the Speaker Notes.
Subjects:
Grades:
8th - 9th
CCSS:
Line of Best Fit PP
Google slides on line of best fit PowerPoint with step by step process on how to find the line of best fit using Desmos and Google sheets.
Subjects:
Grades:
6th - 12th, Higher Education, Adult Education, Staff

Box-and-Whisker PP
Google slides on box and whisker plots, reading box and whisker plots in reverse, and various warmups throughout.
Subjects:
Grades:
6th - 12th, Higher Education, Adult Education, Staff
Mean, Median and Mode PP
Google slides presentation on mean, median, and mode with various warmups included throughout.
Subjects:
Grades:
6th - 12th, Higher Education, Adult Education, Staff
Showing 1-6 of 6 results


