23 results
High school statistics assessments for Easel Activities
![Preview of Statistics Final Exam and Review [AP, College, and Honors]](https://ecdn.teacherspayteachers.com/thumbitem/Statisticis-FinalReviewStudy-Guide-Exam-1711356723/original-699492-1.jpg)
Statistics Final Exam and Review [AP, College, and Honors]
You can use this Statistics Final Exam in an AP Statistics, Honors Statistics, or a College Statistics course as an assessment, review or both. What's Included?Included are 6 different versions, each including 60 well chosen representative questions in both multiple choice format and also in free response format*. These reviews and tests work well in class or as a take- home. The tests are editable with Adobe Acrobat Pro. Each test should take about 2 - 3 hours and can be taken with a graphin
Subjects:
Grades:
10th - 12th, Higher Education
Types:
CCSS:
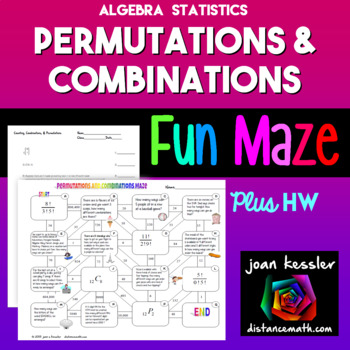
Combinations Permutations FUN Maze plus Quiz HW
This fun activity on Combinations, Permutations, and Counting can be used for Algebra or Statistics and will engage your students while reinforcing the concepts of permutations, combinations, and the counting principles. The different types of problems are placed randomly in the maze so that students must first decide the type of question before solving. The questions on the maze are letter coded so that if a student has a question, he or she can just ask about Question G, for example. There
Subjects:
Grades:
10th - 12th
Types:
CCSS:
Also included in: Algebra 1 Activity Bundle
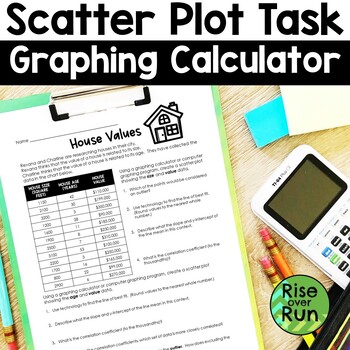
Scatter Plot Worksheet with Graphing Calculator Practice
Need a real world scatter plot activity where students use their graphing calculators? Grab this activity and help your students understand lines of best fit and calculating correlation coefficients!Students are given data on house sizes, house ages, and house values. They use a graphing calculator or computer program to plot the points and answer questions that follow.This is a great activity for partners to explore or for individual work. It can lead to some great math discussions!Answer key
Subjects:
Grades:
8th - 9th
Types:
CCSS:
Also included in: Algebra 1 and 8th Grade Math Curriculum Bundle for Entire Year
ACT Math Test Prep for Probability and Statistics
This ACT resource has 30 questions that cover statistics, probability, number sense, plug and chug, reading tables and charts, scientific notation and more! The answer key comes with explanations for each problem! Standards are included so student can determine weaknesses. You will have access to two versions: PDF and Easel. If you use Easel you will have a copy of the activity that has been digitized and is ready for students to fill in the answers. You can customize it further and then share w
Subjects:
Grades:
10th - 12th
Types:
Also included in: ACT Math Test Prep Bundle
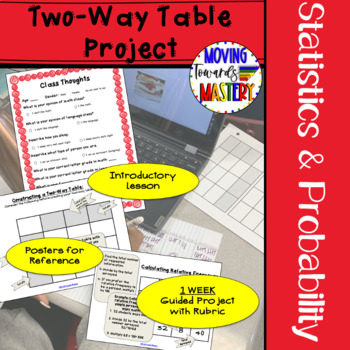
Two Way Frequency Tables End of Year Project Plan
ONE Week guided project plan for constructing and interpreting two-way frequency tables. This engaging project is individualized to allow students to research areas of interest. Can be used year round but is great for an end of year project! Students will gather data on their topic of choice and use the project plan to organize their data into a two way table and frequency table. Students will then analyze the results of the data collection.Two-Way Table Project includes:♦ Suggested Lesson Plann
Subjects:
Grades:
8th - 10th
Types:
CCSS:
Also included in: Middle School Math Projects for End of the Year Activities
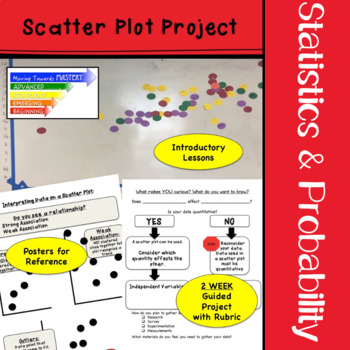
Scatter Plot Project End of Year Math Activity with Real World Data
TWO Week guided project for constructing and interpreting scatter plots. This engaging scatter plot project is individualized to allow students to research areas of interest. This project is great for a math end of year activity but it can also be used year round! Students will gather data on their topic of choice and use the project plan to organize their data into a scatter plot. Students will then analyze the results of the data collected.Six posters to guide students as they work independent
Subjects:
Grades:
8th - 10th, Higher Education
Types:
CCSS:
Also included in: Middle School Math Projects for End of the Year Activities
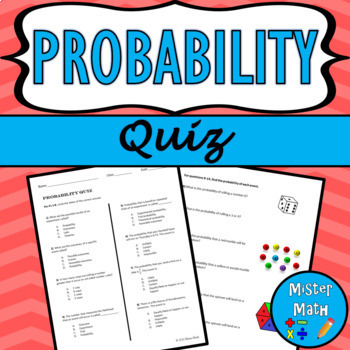
Probability Quiz
Assess your students' knowledge and skills in finding probability with this 22-question quiz! The quiz includes multiple choice and open-response questions, as well as real-life application questions. An answer key is also provided. Overall, the 4-page quiz covers the following topics:Outcomes & EventsDescribing LikelihoodSimple ProbabilityTheoretical/Experimental ProbabilityUsing Theoretical ProbabilityMaking PredictionsComparing Theoretical & Experimental Probability☆ CLICK HERE TO CHE
Subjects:
Grades:
6th - 9th
Also included in: Probability MEGA BUNDLE
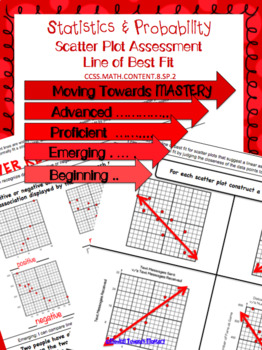
8.SP.2 Scatter Plots: Line of Best Fit Assessment
Assessment for Scatter Plots: Line of Best Fit that measures understanding at various levels of mastery to identify at what level students have progressed. Levels of mastery are:→ Beginning → Emerging→ Proficient→ AdvancedEASY printing with answer key--------------------------------------------------------------------------------------------------------------------------------------------------------------These printable worksheets can also be used as digital resources through the TpT Digital Ac
Subjects:
Grades:
8th - 10th
Types:
CCSS:
Also included in: 8th Grade Common Core Statistics & Probability Assessments
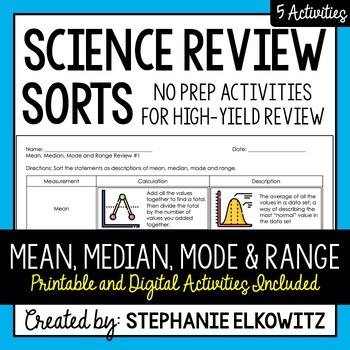
Mean, Median, Mode & Range Review | Printable, Digital & Easel
A NO-PREP resource to review HIGH-YIELD topics in science! My science review sorts help students develop mastery of science concepts, review difficult concepts and avert common misconceptions and misunderstandings. Each individual review sort will target a specific topic. By doing so, students focus their attention and effort on advancing their understanding of scientific ideas and concepts related to that topic. Important Notes:• Download a FREE High-Yield Review Activity• Save $$ with the Natu
Subjects:
Grades:
4th - 9th
Types:
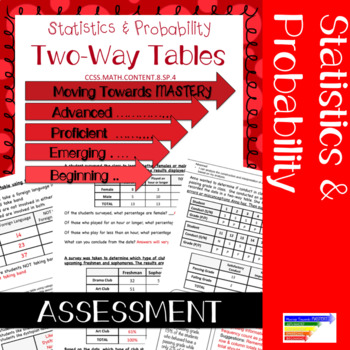
Two Way Frequency Tables Printable Test 8.SP.4 Assessment
Assessment for Two Way Frequency Tables - This printable test will measure understanding at various levels of mastery to identify at what level students have progressed. Levels of mastery are:→ Beginning → Emerging→ Proficient→ AdvancedEASY printing with answer keyCheck out resources for teaching Scatter Plots:Scatter Plot Interactive Google SlidesScatter Plot ProjectScatter Plot PRINTABLECheck out the levels of mastery tool created to introduce the standard in my store:Scatter Plot Levels of Ma
Subjects:
Grades:
8th - 10th
Types:
CCSS:
Also included in: 8th Grade Common Core Statistics & Probability Assessments
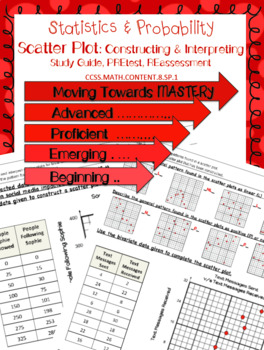
8.SP.1 Construct & Interpret Scatter Plots Pre-test/ Study Guide/ Reassessment
This resource would be useful in the following ways:→ Pre-test before introducing the standard→ Study Guide to prepare for the assessment→ Reassessment This resource will allow you to measure student understanding of how to construct and interpret a scatter plot at various levels of mastery to identify at what level students are prior to instruction or after instruction. Levels of mastery are:→ Beginning → Emerging→ Proficient→ AdvancedEASY printing with answer key-------------------------------
Subjects:
Grades:
8th - 10th
CCSS:
Also included in: 8th Grade Common Core Statistics & Probability Assessments
Correlation vs Causation Quiz
Hello Math Teachers! Looking for an effective way to teach your Algebra students the critical distinction between correlation and causation? Look no further! Our two sided quiz is expertly designed to help students evaluate statements and determine whether they illustrate correlation or causation, a vital skill in the world of statistics.Key Features of this Quiz:Causation vs. Correlation Focus: This quiz hones in on the crucial difference between causation and correlation. It's the perfect tool
Subjects:
Grades:
9th
Types:
CCSS:
Also included in: Data and Statistics Worksheets Bundle
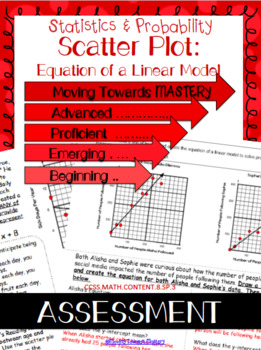
8.SP.3 Scatter Plots: Equation of a Linear Model Assessment
Assessment for Scatter Plots: Equation of a Linear Model that measures understanding at various levels of mastery to identify at what level students have progressed. Levels of mastery are:→ Beginning → Emerging→ Proficient→ AdvancedEASY printing with answer key--------------------------------------------------------------------------------------------------------------------------------------------------------------These printable worksheets can also be used as digital resources through the TpT
Subjects:
Grades:
8th - 10th
Types:
CCSS:
Also included in: 8th Grade Common Core Statistics & Probability Assessments
Z-Scores - Multiple Choice Questions
Digital/Printable - Twenty Multiple Choice Questions on Z-Scores!Tests basic calculation of Z-Scores, word problems & conceptual understanding of what Z-Scores mean. Product includes answer key. © The Stat Cat 2021
Subjects:
Grades:
10th - 12th, Higher Education
Types:
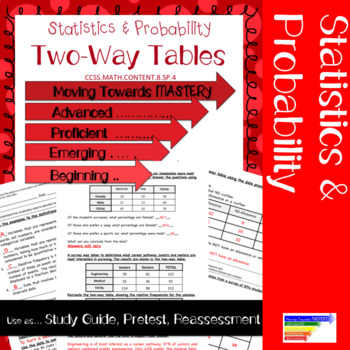
Two Way Frequency Tables Activity 8.SP.4 Pre Test, Study Guide, or Reassessment
The Two Way Frequency Tables Activity is great for a pre test before introducing the standard, study guide to prepare for an assessment, or as a reassessment. This resource will allow you to measure student understanding of two way frequency tables at various levels of mastery to identify at what level students are prior to instruction or after instruction. Levels of mastery are:→ Beginning → Emerging→ Proficient→ AdvancedEASY printing with answer keyNeed the TEST for this standard? Click the ti
Subjects:
Grades:
8th - 10th
CCSS:
Also included in: 8th Grade Common Core Statistics & Probability Assessments
Central Tendency Activity Error analysis
Students take on the role of “teacher” when they must assess and correct the statistics exam presented to them. Students identify errors in z-distribution, interpreting data and more.This resource includes:- Student activity/handouts- Teacher's guide- Answer Key This resource is a good review for the end of Algebra 2 Unit 11 Data Analysis and Statistics . Topics reviewed include:- Central tendency - Applying Transformations of Data- Normal Distributions - Selecting and draw conclusions from sam
Subjects:
Grades:
10th - 12th
Types:
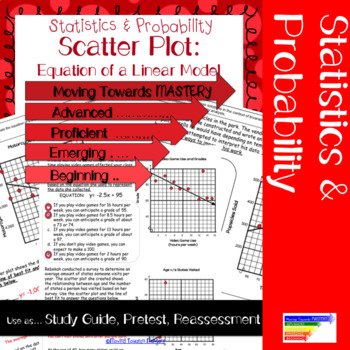
8.SP.3 Scatter Plots: Equation of a Linear Model: Pretest/ Study Guide/ Reassess
This resource would be useful in the following ways:→ Pre-test before introducing the standard→ Study Guide to prepare for the assessment→ Reassessment This resource will allow you to measure student understanding of equations of linear models at various levels of mastery to identify at what level students are prior to instruction or after instruction. Levels of mastery are:→ Beginning → Emerging→ Proficient→ AdvancedEASY printing with answer key--------------------------------------------------
Subjects:
Grades:
8th - 10th
Types:
CCSS:
Also included in: 8th Grade Common Core Statistics & Probability Assessments
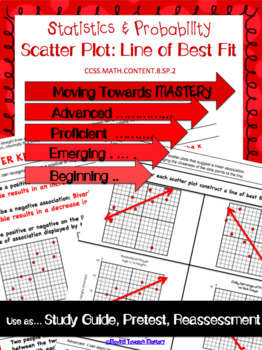
8.SP.2 Scatter Plots: Line of Best Fit Pre-test/ Study Guide/ Reassessment
This resource would be useful in the following ways:→ Pre-test before introducing the standard→ Study Guide to prepare for the assessment→ Reassessment This resource will allow you to measure student understanding of how to construct a line of best fit on a scatter plot at various levels of mastery to identify at what level students are prior to instruction or after instruction. Levels of mastery are:→ Beginning → Emerging→ Proficient→ AdvancedEASY printing with answer key-----------------------
Subjects:
Grades:
8th - 10th
CCSS:
Also included in: 8th Grade Common Core Statistics & Probability Assessments

Census Demographic Data Internet Activity and Activity
Students collect, analyze and investigate Demographic Census Data in a compounding assignment mad for online activities or project based presentations.. Students will find resources and information from online examples to demonstrate their understanding and analysis about topics and issues on political demography. Independent or group based activity made for online or in person completion of activity. Self guided instructions with links and resources included for students to use as necessary to
Grades:
9th - 12th, Higher Education, Adult Education
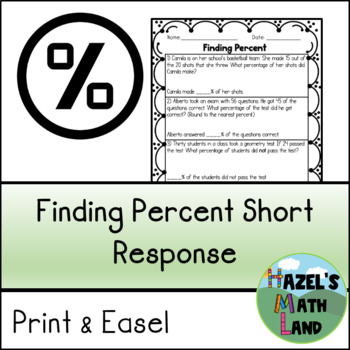
Finding Percent Short Response Questions (Print & Easel)
This resource is a great way to asses the students knowledge on finding the percent of a ratio. There are a total of 12 questions. Students are given a scenario and asked to find the percentage representation of the given relationship. There is enough space between questions for students to show their work. Answer Key Included.ABOUT THIS RESOURCE6 pages3 WorksheetsExcellent for Middle and High SchoolANSWER KEY INCLUDED******************************************************************************
Subjects:
Grades:
6th - 9th
Types:
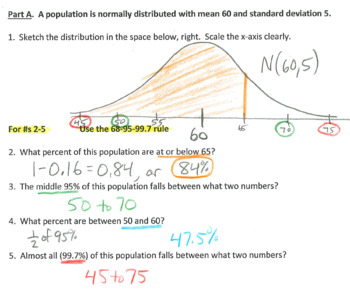
Statistics Quiz: the normal distribution
One practice quiz (with answer KEY!) and two forms of a "real quiz" (answer KEYs provided!) on the normal distribution. Students must sketch and label a bell curve, use the 68-95-99.7 rule, compute z-scores and use a z-table (commonly referred to as "Table A").
Subjects:
Grades:
9th - 12th
Types:
Statistical Questions Quiz
This is a simple statistical questions quiz that contains 6 questions that review various types of situations students may encounter when defining, recognizing and writing statistical questions. The quiz is worth 12 points, 2 points per question giving students more opportunity to earn points by showing work & giving accurate answers. This easy-to-grade quiz is perfect for a quick check for understanding before an assessment.
Subjects:
Grades:
4th - 9th
Types:
Also included in: 6th Grade Math Quiz Bundle
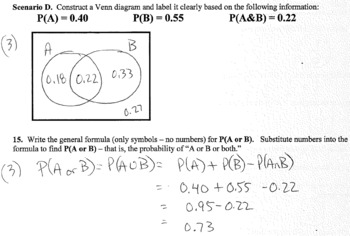
Statistics Quiz: Basic Probability (two versions)
Two versions of a quiz on basic probability concepts (answer KEYS provided). One quiz could be used as a practice/review. Includes sample space, independent events, mutually exclusive events, Venn diagrams, and the complement rule.
Subjects:
Grades:
9th - 12th
Types:
Showing 1-23 of 23 results


