341 results
Statistics assessments for Google Apps
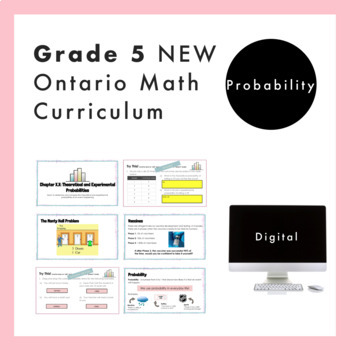
Grade 5 Ontario Math - Probability Curriculum - Digital Google Slides+Form
Are you planning for the NEW Grade 5 Ontario Math Curriculum? This fully editable, NO PREP Google Slide resource is what you need! This resource is for the DATA strand and covers all specific expectations for “D2. Probability”. In this resource, students will experience math through engaging real-life questions, storytelling through math, and interactive slides. For teachers who are given Nelson© Math by your board, this resource loosely follows the order of the Probability chapter (Chapter 13)
Subjects:
Grades:
4th - 6th
Also included in: Grade 5 NEW Ontario Math Curriculum Full Year Digital Slides Bundle
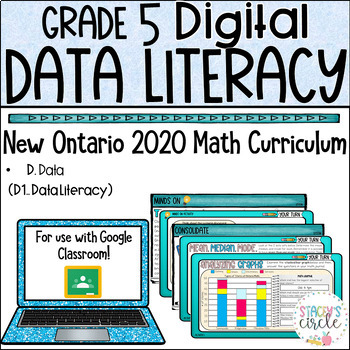
Grade 5 NEW Ontario Math Data Literacy Unit Digital Slides
This resource includes a comprehensive and engaging Grade 5 Ontario Math Data Literacy Unit including 3-part lessons, skill practice, self-grading assessment, and social emotional learning. This unit covers EVERY SPECIFIC Expectation from the 2020 Ontario D1. Data Literacy Strand. WHY BUY THIS PRODUCT OVER OTHERS?My vision for teaching math is always "Don't just tell the story, let the students experience the story first hand. HOW?Students will be walked through curriculum concepts step-by-step
Subjects:
Grades:
4th - 6th
Types:
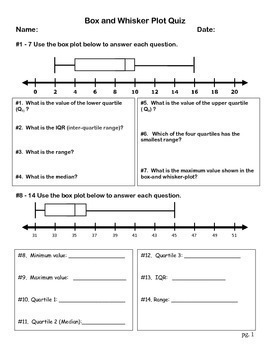
Box and Whisker Plot Quiz (Paper Format & Google Form)
PDF Copy & Google Form This 25 question quiz assess student's understanding of box and whisker plots. Questions are asked about median, IQR, range, lower extreme, upper extreme, and more. Students are also tasked with finding the median of several data sets as well as determining the five number summary of a data set. Check out the preview!
Subjects:
Grades:
6th - 8th
Types:
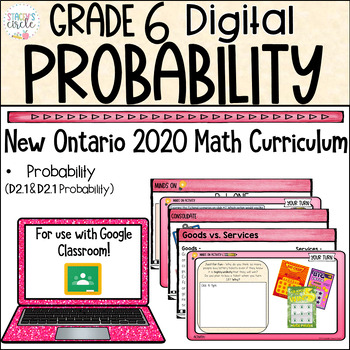
Grade 6 Ontario Math Probability Unit Digital Slides
Are you looking for an engaging and relatable way to teach your students concepts from the entire Grade 6 Ontario Math Probability strand? Your search ends here. WHY BUY THIS PRODUCT OVER OTHERS?My vision for teaching math is always "Don't just tell the story, let the students experience the story first hand. HOW?Students will be walked through curriculum concepts step-by-step in easy-to-understand language using identifiable and relatable problemsRather than mostly instructional slides, this pr
Subjects:
Grades:
5th - 7th
Types:
Also included in: Grade 6 Ontario Math Curriculum FULL YEAR Digital Slides Platinum Bundle
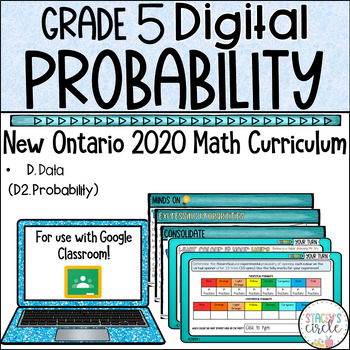
Grade 5 Probability 2020 Ontario Math Digital Googles Slides : D . Data
This resource includes a comprehensive Grade 5 Ontario Math Probability curriculum unit including lessons, activities, assessment and social emotional learning skills.This unit covers EVERY SPECIFIC Expectation from the 2020 Ontario D2. Probability (D. Data) strand. WHY BUY THIS PRODUCT OVER OTHERS?My vision for teaching math is always "Don't just tell the story, let the students become part of the story".Students will be walked through curriculum concepts step-by-step in easy-to-understand lang
Subjects:
Grades:
4th - 6th
Types:
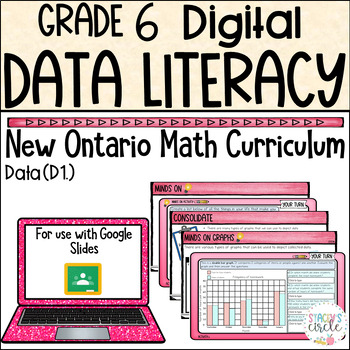
Grade 6 Data Literacy 2020 Ontario Math Digital Google Slides : D. Data
This resource includes a comprehensive and fully hands-on and interactive unit covering the entire Data Literacy strand from the Grade 6 New Ontario Math Curriculum. (D1.1-D1.6). WHY BUY THIS PRODUCT OVER OTHERS?My vision for teaching math is always "Don't just tell the story, let the students experience the story first hand. HOW?Students will be walked through curriculum concepts step-by-step in easy-to-understand language using identifiable and relatable problems.Rather than mostly instruction
Subjects:
Grades:
5th - 7th
Types:
Also included in: Grade 6 Ontario Math Curriculum FULL YEAR Digital Slides Platinum Bundle
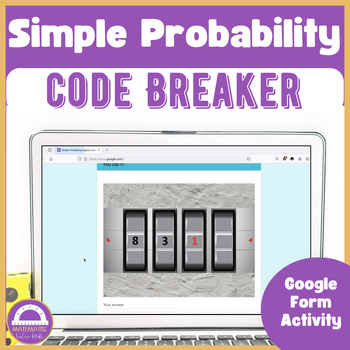
Simple Probability | Digital Escape Room Code Breaker Activity
Ready to break the code by solving probability problems? This Simple Probability | Digital Escape Room Code Breaker includes 20 problems that you and your students must solve to figure out how to open the safe! This Google Form activity is perfect to have 7th grade students practice solving probability problems while having fun.EDIT: Added a set of printable task cards, handouts and solutions.I would use this activity as a way to practice solving probability with my students. You could use this
Subjects:
Grades:
6th - 9th
Types:
Also included in: Bundle Statistics and Probability | 50% Discount
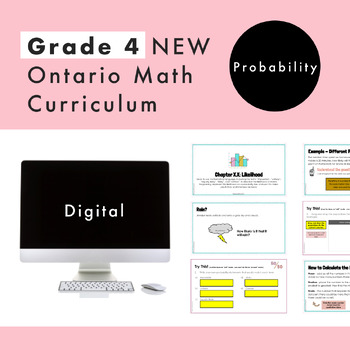
Grade 4 Ontario Math - Probability - Digital Google Slides + Form
Are you planning for the NEW Grade 4 Ontario Math Curriculum? This editable Google Slide and Google Form resource is what you need! This resource is for the DATA strand and and covers specific expectations for “D2. Probability”. In this resource, students will experience math through engaging real-life questions, storytelling through math, and interactive slides. What’s Included2 Google Slide presentations45 UNIQUE and EDITABLE Google Slides in totalSlides are editable for you to increase stud
Subjects:
Grades:
3rd - 5th
Types:
Also included in: Grade 4 NEW Ontario Math Curriculum Full Year Digital Slides Bundle
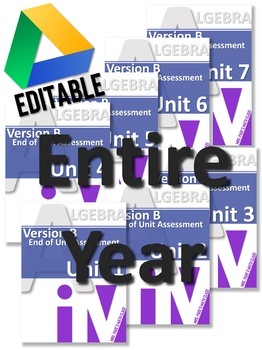
Version B End of Unit Assessments/Retakes for IM Algebra 1 Math™ Units 1-7
This is a Version B Assessment bundle aligned to Illustrative Mathematics for Algebra 1. This Version B assessment bundle is aligned to the same CCSS standards as the original exams and is modeled after the same type of problems accompanying the Algebra 1 exams. So, it naturally lends to standards based grading, if that is a practice in which you choose to participate. This exam can be used as a retake for students to show mastery after reteaching lessons or student independent study or it can b
Subjects:
Grades:
8th - 11th
Types:
CCSS:
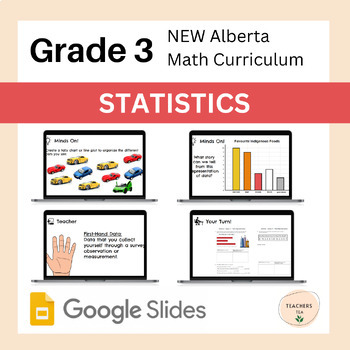
Alberta Grade 3 Math- Statistics- Google Slides COMPLETE UNIT
This is a COMPLETE UNIT to deliver the New Grade 3 Alberta Math Patterns and Sequences Unit.This is a ready-to-teach, ready-to-print unit that you can use in any elementary classroom. It is fully editable and can be adjusted for other standards and outcomes and grade levels.This Unit Includes the Google Slides Patterns and Sequences Unit, Student Sheets and Unit Exam to accompany the unit plan.New Alberta Math Curriculum Resources for Grade 3:AlgebraTimeMeasurementGeometryStatisticsPatterns and
Subjects:
Grades:
2nd - 4th
Types:
Also included in: Alberta Grade 3 Math - BUNDLE - 10 COMPLETE UNITS - FULL YEAR RESOURCE
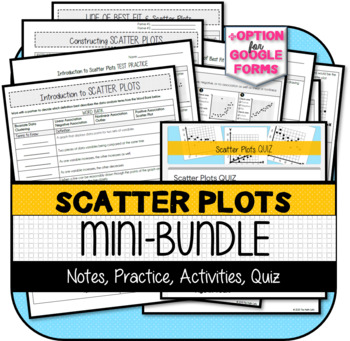
Scatter Plots MINI-BUNDLE
This resource contains the following items:1) Notes with Practice Problems2) Activities (Constructing Scatter Plots & Matching Line of Best Fit)3) Test Practice4) Quiz5) Answer KeysThis resource was developed to meet the requirements of the 8th Grade Statistics & Probability Standards below:CCSS.MATH.CONTENT.8.SP.A.1 Construct and interpret scatter plots for bivariate measurement data to investigate patterns of association between two quantities. Describe patterns such as clustering, out
Subjects:
Grades:
7th - 9th
Types:
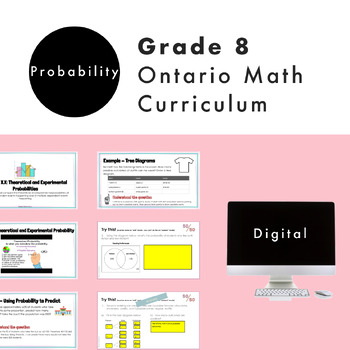
Grade 8 Ontario Math Probability Digital Google Slides + Form
Do you need a practical and engaging resource for the NEW Ontario Math Number strand? Are you planning for the NEW Grade 8 Ontario Math Curriculum? This editable Google Slide resource is what you need! This resource is for the Grade 8 DATA strand and covers specific expectations for “D2 Probability". In this resource, students will experience math through engaging real-life questions, storytelling through math, and interactive slides. What’s Included2 Google Slide presentations67 UNIQUE and ED
Subjects:
Grades:
7th - 9th
Types:
Also included in: Grade 8 NEW Ontario Math Curriculum Full Year Digital Slides Bundle
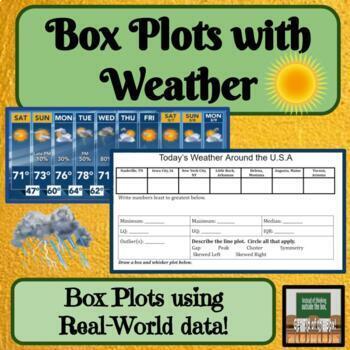
Box and Whisker Plots Real World Math Middle School Math
About this Resource:Students use current weather data from all over to create box plots using measures of variation. This is a create way to tie in some live science data! Topic Covered:*Measures of Variation/Variability*Describing Graphs*Box Plots / Box-and-Whisker Plots Ways to use this product in your classroom:-project-assessment-independent or partner work✓ Teacher Tested✓ Student Approved*This product has been used in my classroom and enjoyed by my students!Other products with similar con
Subjects:
Grades:
6th - 8th
Types:
Also included in: Box and Whisker Plots Line Plots Measures of Center Bundle Activities
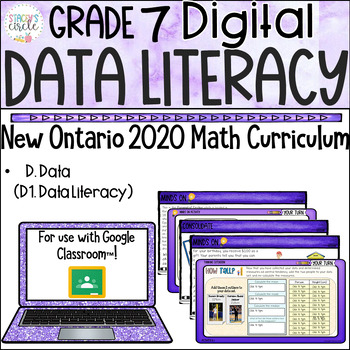
Grade 7 Data Literacy NEW Ontario Math Digital Google Slides : D . Data
This comprehensive digital Ontario Math resource covers EVERY single specific expectation from the D1. Data Literacy strand in the NEW Grade 7 2020 Ontario Math Curriculum-- See below for specific expectations. Grade 7 Teachers, you're going to want this in your collection! WHY BUY THIS PRODUCT OVER OTHERS?My vision for teaching math is always "Don't just tell the story, let the students experience the story first hand". HOW?Students will be walked through curriculum concepts step-by-step in eas
Subjects:
Grades:
6th - 8th
Types:
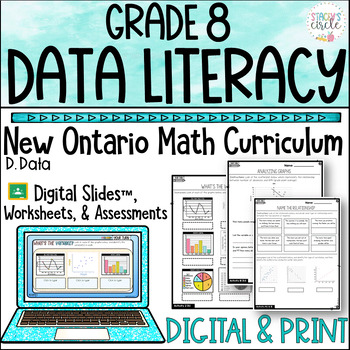
Grade 8 Ontario Math Data Literacy Digital Slides Worksheets and Assessments
Are you a Grade 8 Ontario Math Teacher looking to excite and engage your math learners with a no-prep complete Grade 8 Data Literacy Mega unit in digital AND printable formats? If you're tired of pulling resources from multiple different sources, then this comprehensive Ontario Curriculum-Aligned resource including lessons, activities, and editable assessments in print and digital formats by Stacey's Circle is the solution! NOTE: This resource includes a COMPLETE Digital & Printable unit cov
Subjects:
Grades:
6th - 8th
Types:
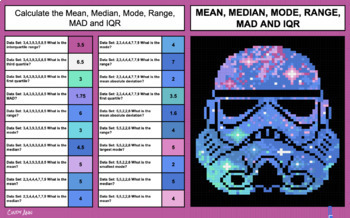
Math Pixel Art - Mean, Median, Mode, Range, MAD and IQR - May the Fourth
Math Pixel Art - Mean, Median, Mode, Range, MAD and IQR - May the Fourth - Abstract Trooper- Let your students skill practice come to life with this solve and reveal pixel art. With each correct answer the pixels appear. Finish all your skill drills, and you have an awesome Star Wars™️ themed picture! Celebrate May the Fourth with colorful solve and reveal pixel art.Students calculate the Mean, Median, Mode, Range, MAD and IQR to reveal a pixel art image in Google™ Sheets piece by piece. The im
Subjects:
Grades:
7th - 12th
Types:

Dot Plots, Histograms, and Box Plots Quiz for Google Forms™ - 6.SP.4
About This Resource:This is a Google Forms Quiz on creating and interpreting dot plots, histograms, and box plots. The instructions are easy to follow for you to make a copy of the quiz to your Google Drive. Then you can assign to your students using Google Classroom or some other method.Questions on this assessment were carefully created to give our students the best practice on the following standard.6.SP.4 - Display numerical data in plots on a number line, including dot plots, histograms, an
Subjects:
Grades:
6th - 10th
Types:
CCSS:
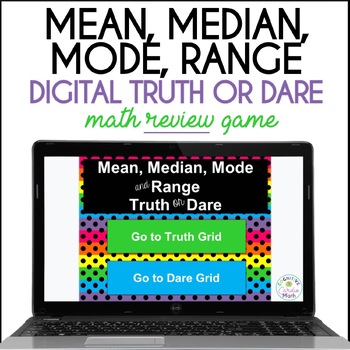
Mean, Median, Mode & Range Truth or Dare Math Game Digital Resource Math Centers
This unique mean, median, mode, range digital math game is an engaging, self-checking, easy way to review concepts - as a whole class, in small groups, partners, or individually. (This is the digital version of the FREE print Mean, Median, Mode & Range Truth or Dare Review Game.)The game begins with a Truth grid and Dare grid that allows students to then navigate through 36 question cards and 36 answer cards in Google Slides. As long as you have access to Google Slides, you can use this math
Subjects:
Grades:
4th - 6th
Types:
CCSS:
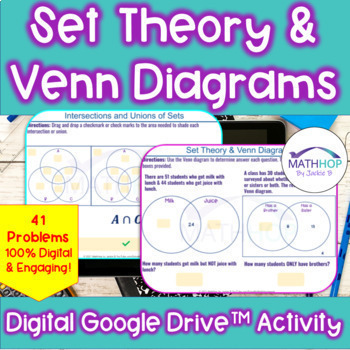
Set Theory & Venn Diagrams (Intersections, Unions, Complements)
Need engaging additional practice on unions, intersections, complements of sets using Venn diagrams? Students drag and drop to shade intersections, complements, & unions, they type directly into slides to create Venn diagrams and use unions, intersections, and complements to answer questions based on Venn diagrams. This activity includes 41 problems to solidify student understanding, completely digital NO Prep needed. Includes 41 Problems that cover:•Determine intersection of sets•Determine
Subjects:
Grades:
9th - 12th
Types:
CCSS:
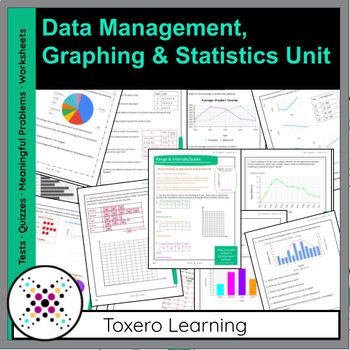
Grade 6, Data Management, Graphing & Statistics (Unit 7)
The Grade 6 Math Program is designed to take the stress out of teaching! It is a fusion of traditional practice, coupled with modern teaching approaches to encourage authentic learning and deeper thinking.Each unit can be successfully executed individually, but were ideally designed to go in consecutive order for the year. Some concepts reappear in other units to encourage a holistic approach to mathematics. Algebra is intentionally woven throughout the entire Grade 8 Program to provide ample an
Subjects:
Grades:
5th - 7th
Types:
Also included in: Grade 6 Math Year with EDITABLE Assessments, Growing Bundle
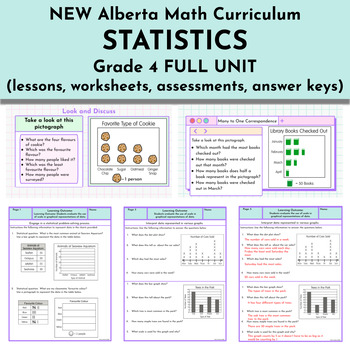
Statistics Unit - NEW Alberta Math Curriculum Grade 4
This Grade 4 Statistics resource is intended to meet the NEW 2023 Alberta Math curriculum expectations. Learning Outcome: Students evaluate the use of scale in graphical representations of data.Skills and Procedures:Engage in a statistical problem-solving process.Select an appropriate scale to represent data.Represent data in a graph using many-to-one correspondence.Describe the effect of scale on representation.Justify the choice of graph used to represent certain data.Compare different graphs
Subjects:
Grades:
4th
Types:
Also included in: FULL YEAR Alberta Math Curriculum - Grade 4
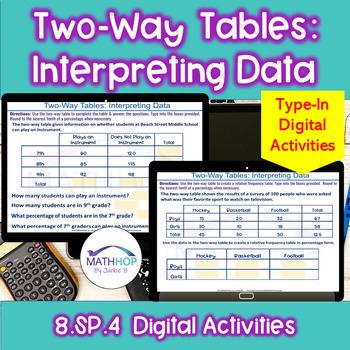
Two-Way Tables & Relative Frequency Tables: Interpreting Data - Digital Activity
Need engaging practice for students to practice interpreting data from two-way tables & relative frequency tables and creating relative frequency tables? This collection of NO PREP Digital problems provide practice on creating & interpreting two-way tables & relative frequency tables in percentage form. Students struggle with data in two-way tables but practice CAN BE engaging. These digital activities that can be used as homework, assessments, supplemental activities.⭐ 12 total slid
Subjects:
Grades:
8th - 9th
Types:
CCSS:
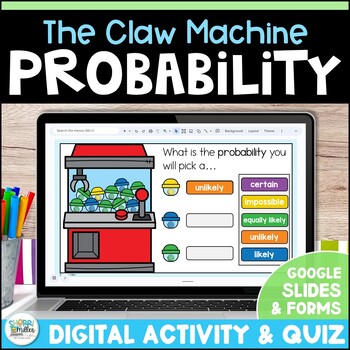
Probability Digital Math Activities and Assessment - Google Slides & Forms
Make teaching probability and chance fun with these engaging digital Google Slides math activities and Google Forms self-grading assessment! Your students will love the claw machine theme that is perfect to explain the likelihood of an outcome. These easy to use resources are also NO PREP to save you planning time! No need to take papers home to grade! The Google Forms quiz will test your students’ understanding of probability and give you instant data. ➡️ Click the PREVIEW above to see more i
Subjects:
Grades:
2nd - 4th
Types:
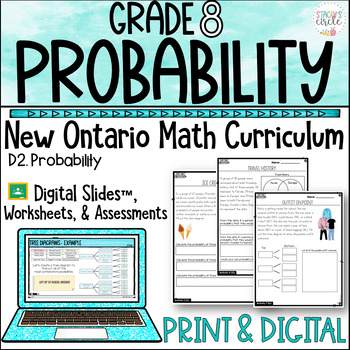
Grade 8 Ontario Math Probability Printable and Digital Unit
Are you an Ontario Math Teacher looking to excite and engage your math learners with a no-prep complete Grade 8 Probability Unit in digital AND printable formats? If you're tired of pulling resources from multiple different sources, then this comprehensive Ontario Curriculum-aligned resource by Stacey's Circle is the solution!NOTE: This resource covers the specific expectations -D2.1 and D2.2Your purchase comes in PRINT & DIGITAL Formats.WHY BUY THIS PRODUCT OVER OTHERS?My vision for teachin
Subjects:
Grades:
7th - 9th
Types:
Showing 1-24 of 341 results


