873 results
High school statistics assessments under $5
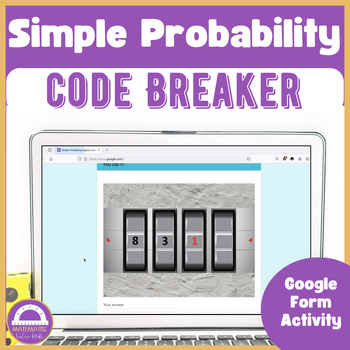
Simple Probability | Digital Escape Room Code Breaker Activity
Ready to break the code by solving probability problems? This Simple Probability | Digital Escape Room Code Breaker includes 20 problems that you and your students must solve to figure out how to open the safe! This Google Form activity is perfect to have 7th grade students practice solving probability problems while having fun.EDIT: Added a set of printable task cards, handouts and solutions.I would use this activity as a way to practice solving probability with my students. You could use this
Subjects:
Grades:
6th - 9th
Types:
Also included in: Bundle Statistics and Probability | 50% Discount
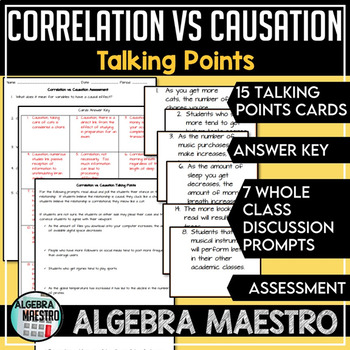
Correlation vs. Causation Talking Points, Prompt & Assessment
The Correlation vs. Causation Talking Points includes task cards, prompts to incorporate discussion, and an assessment. The task cards and assessment have answer keys attached with brief explanations. There are 15 task cards where students can work individually, pairs, or small groups identifying whether cards form a correlation or causation relationship. In the Talking Points, this is designed to be whole class where students take a side on what they believe a passage to be. The assessment
Subjects:
Grades:
5th - 12th
Types:
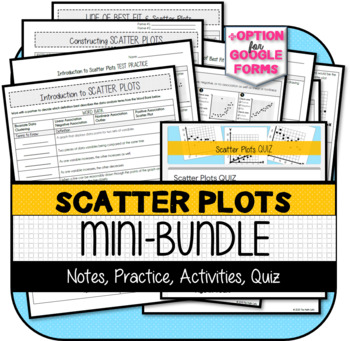
Scatter Plots MINI-BUNDLE
NOTE: Google Apps Options - Only the ASSESSMENTS have Google Apps options. This bundle is NOT ideal for "Distance Learning" unless you have special access to PDF editors that remove answer keys, etc.This resource was developed to meet the requirements of the 8th Grade Statistics & Probability Standards below:CCSS.MATH.CONTENT.8.SP.A.1Construct and interpret scatter plots for bivariate measurement data to investigate patterns of association between two quantities. Describe patterns such as cl
Subjects:
Grades:
7th - 9th
Types:
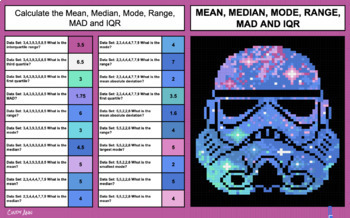
Math Pixel Art - Mean, Median, Mode, Range, MAD and IQR - May the Fourth
Math Pixel Art - Mean, Median, Mode, Range, MAD and IQR - May the Fourth - Abstract Trooper- Let your students skill practice come to life with this solve and reveal pixel art. With each correct answer the pixels appear. Finish all your skill drills, and you have an awesome Star Wars™️ themed picture! Celebrate May the Fourth with colorful solve and reveal pixel art.Students calculate the Mean, Median, Mode, Range, MAD and IQR to reveal a pixel art image in Google™ Sheets piece by piece. The im
Subjects:
Grades:
7th - 12th
Types:

Dot Plots, Histograms, and Box Plots Quiz for Google Forms™ - 6.SP.4
About This Resource:This is a Google Forms Quiz on creating and interpreting dot plots, histograms, and box plots. The instructions are easy to follow for you to make a copy of the quiz to your Google Drive. Then you can assign to your students using Google Classroom or some other method.Questions on this assessment were carefully created to give our students the best practice on the following standard.6.SP.4 - Display numerical data in plots on a number line, including dot plots, histograms, an
Subjects:
Grades:
6th - 10th
Types:
CCSS:
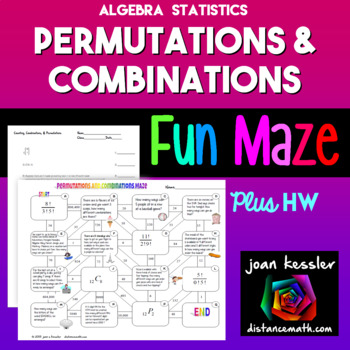
Combinations Permutations FUN Maze plus Quiz HW
This fun activity on Combinations, Permutations, and Counting can be used for Algebra or Statistics and will engage your students while reinforcing the concepts of permutations, combinations, and the counting principles. The different types of problems are placed randomly in the maze so that students must first decide the type of question before solving. The questions on the maze are letter coded so that if a student has a question, he or she can just ask about Question G, for example. There
Subjects:
Grades:
10th - 12th
Types:
CCSS:
Also included in: Algebra 1 Activity Bundle
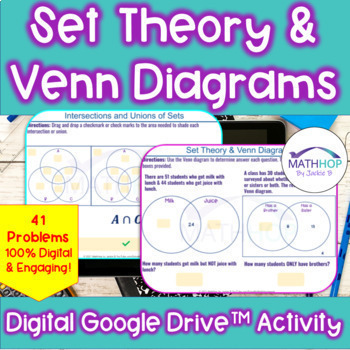
Set Theory & Venn Diagrams (Intersections, Unions, Complements)
Need engaging additional practice on unions, intersections, complements of sets using Venn diagrams? Students drag and drop to shade intersections, complements, & unions, they type directly into slides to create Venn diagrams and use unions, intersections, and complements to answer questions based on Venn diagrams. This activity includes 41 problems to solidify student understanding, completely digital NO Prep needed. Includes 41 Problems that cover:•Determine intersection of sets•Determine
Subjects:
Grades:
9th - 12th
Types:
CCSS:
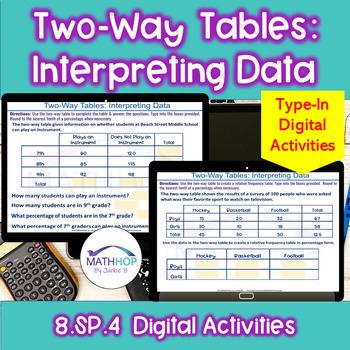
Two-Way Tables & Relative Frequency Tables: Interpreting Data - Digital Activity
Need engaging practice for students to practice interpreting data from two-way tables & relative frequency tables and creating relative frequency tables? This collection of NO PREP Digital problems provide practice on creating & interpreting two-way tables & relative frequency tables in percentage form. Students struggle with data in two-way tables but practice CAN BE engaging. These digital activities that can be used as homework, assessments, supplemental activities.⭐ 12 total slid
Subjects:
Grades:
8th - 9th
Types:
CCSS:

Probability, Simple & Compound Task Cards
Probability, Simple & Compound Task Cards
This is a set of 24 task cards covering multiple representations of simple and compound probability. The questions are differentiated for a wide range of learners. These cards would be great for bell ringers, math stations, test prep, review, or just for fun!
What you get:
➸ 24 color task cards
➸ 24 black and white task cards
➸ Student answer sheet
➸ Key
You can laminate these and use them again and again. You could also hole punch each and keep
Subjects:
Grades:
5th - 9th
Types:
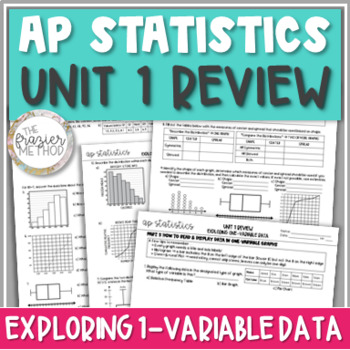
AP Statistics Review of Normal Distribution Histogram Box Plot Shape & Center
5 PAGES on histograms, boxplots, dot plots, stem-and-leaf, 5 number summary, percentiles, symmetric or skewed shape, median or mean for center, standard deviation or interquartile range for spread, outliers, Normal Distribution, z-scores, and more! This AP STATS EXAM REVIEW for Unit 1: Exploring One-Variable Data is great AP Stats Exam prep without the same old boring multiple choice problems or free response questions! Aligns with AP College Board’s updated 2019-2020 objectives and standards fo
Subjects:
Grades:
10th - 12th

Measures of Center and Spread |Mean, Median, Standard Deviation, +|Google Forms™
Included in this Product: 100% Self-Grading Assessment or Homework using Google Forms™ - Measures of Center and Spread - Mean, Median, Range, Interquartile Range, Standard Deviation - 26 Questions each (9 multiple choice, 15 free response, and 2 checkbox). The default multiple choice answer order is generally set to be "shuffled" to prevent cheating. However, this can be edited. 2 similar versions for the price of 1!! Having a second version of the form allows for retakes and also gives you opt
Subjects:
Grades:
8th - 12th
Types:
CCSS:
Also included in: Algebra 2 Google Forms™
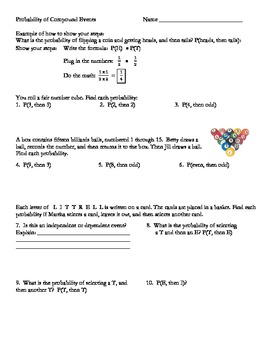
Probability: Compound Events (Independent and Dependent)
This 3 page document has a variety of compound event problems. It has built-in differentiation because the problems get progressively harder. There are even problems that combine independent and dependent events. There is an answer key.
Subjects:
Grades:
6th - 9th
Types:
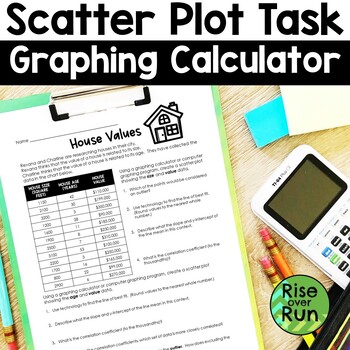
Scatter Plot Worksheet with Graphing Calculator Practice
Need a real world scatter plot activity where students use their graphing calculators? Grab this activity and help your students understand lines of best fit and calculating correlation coefficients!Students are given data on house sizes, house ages, and house values. They use a graphing calculator or computer program to plot the points and answer questions that follow.This is a great activity for partners to explore or for individual work. It can lead to some great math discussions!Answer key
Subjects:
Grades:
8th - 9th
Types:
CCSS:
Also included in: Algebra 1 and 8th Grade Math Curriculum Bundle for Entire Year
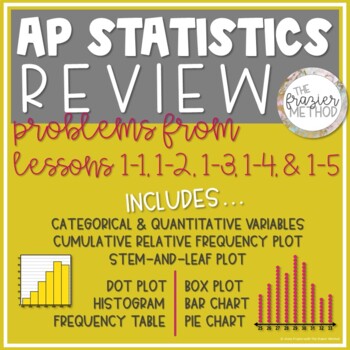
AP Statistics Review - Histogram, Box Plot, Stem-and-Leaf, Bar Graph, Pie Chart
REVIEW OF 1-1, 1-2, 1-3, 1-4, & 1-5 (1 Page, Front & Back)ANSWER KEY INCLUDEDProblems align with The Frazier Method’s Notes from Unit 1: Exploring One-Variable Data:Lesson 1-1: Categorical & Quantitative VariablesLesson 1-2: Displaying 1 Categorical Variable – Frequency Table, Bar Graph, Pie ChartLesson 1-3: Displaying 1 Quantitative Variable Part 1 – Dot Plot, Stem-and-Leaf Plot, HistogramLesson 1-4: Displaying 1 Quantitative Variable Part 2 – Cumulative Relative Frequency PlotLesso
Subjects:
Grades:
9th - 12th
Types:
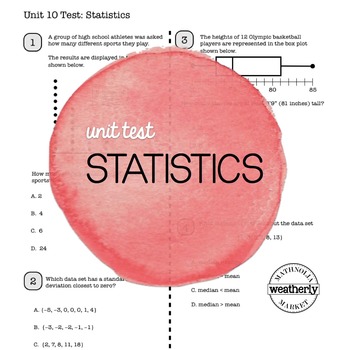
STATISTICS Unit Test CC Algebra 1
The Algebra I Common Core Unit Test will assess your students’ understanding of STATISTICS
Included topics:
Graphical Displays
Quartiles
Box Plots
Measures of Central Tendency
Variation
Two Way Frequency Tables
BiVariate Data
Linear Regression
Quantifying Predictability
Residuals
This assessment can serve as a test at the end of the unit, as a diagnostic tool prior to teaching the topics or as a “test prep” activity prior to state testing.
CCSS addressed:
N-Q.1
S-ID.1
S-ID.2
S-ID.3
S-ID.5
Subjects:
Grades:
9th - 12th
Types:
CCSS:
Also included in: Algebra 1 assessments - UNIT TEST BUNDLE
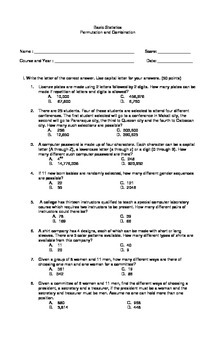
Probability and Statistics Multiple Choice on Permutation and Combination
Grab this Worksheet! a 25 multiple choice questions on probability's Permutation and Combination that will enhance and gain student's understanding on the topic!you can have this as a quiz or as a practice exercises in your class! a must have!!Viva Math!
Subjects:
Grades:
9th - 12th, Higher Education, Adult Education
Types:
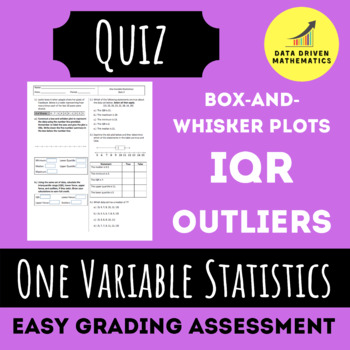
One Variable Statistics Quiz 2 (Box-and-Whisker Plots, IQR, and Outliers)
About This Resource:With this purchase you will receive the second quiz of my One Variable Statistics Unit. This quiz covers box-and-whisker plots, the interquartile range, and identifying outliers. Your purchase will also include the answer key.The questions are meant to prep our students for the Smarter Balanced Assessment (SBAC testing) with a variety of different question formats you might find on the state assessment.What's Included:You will receive a zipped folder. Inside the zipped folder
Subjects:
Grades:
6th - 10th
Types:
CCSS:
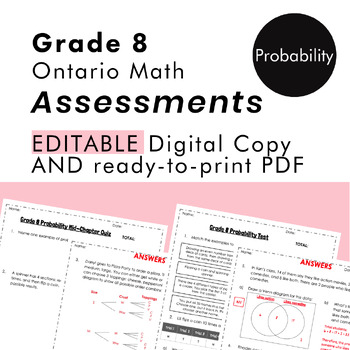
Grade 8 Ontario Math - Probability Assessments - PDF + Google Slides
This resource is for the Grade 8 DATA strand of Probability. ***This resource is meant to be used with my Grade 8 Probability digital unit but can also be used separately.*** Do you need summative assessments for the NEW Ontario Math Curriculum? This NO-PREP, PDF and editable resource is what you need! This resource contains summative assessments for your students to apply what they have learned in the Data strand. This package contains 2 assessments: a Mid-Chapter Quiz and a Unit Test. The ass
Subjects:
Grades:
7th - 9th
Types:
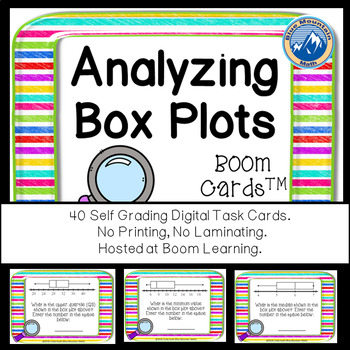
Analyzing Box Plots Boom Cards--Digital Task Cards
Boom Cards™ are a great way for students to practice skills analyzing Box Plots--formerly called Box and Whisker Plots. You can assess their understanding and students can play again to keep improving. This set uses a variety of different plots and asks question about lower quartile, upper quartile, median, interquartile range, range and outliers. This set of Boom Cards features 40 different Digital Self-Checking Task Cards. (No printing, cutting, laminating, or grading!)
Boom Cards live in the
Subjects:
Grades:
7th - 10th
Types:
CCSS:
Also included in: Algebra 1 Bundle Boom Cards--Digital Task Cards Distance Learning
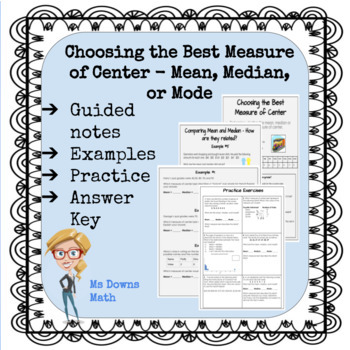
Choosing the Best Measure of Center - Mean, Median or Mode
This lesson is about how to choose which measure of center is best - Mean, Median, or Mode. I use this lesson in my Introduction to Statistics high school course.The guided lesson shows examples with skewed data and without. There is a practice (homework) assignment with 6 questions.An answer key to the entire lesson is provided as well.
Subjects:
Grades:
8th - 12th
Types:
Create Your Own Statistics Project
This document contains a statistics project description that allows students to create their own project. This is suitable for high school and beginning level college statistics class. Students will design their own study - formulate research questions, collect data, organize and summarize the findings, calculate confidence interval and construct hypothesis testing. Certain restrictions are outlined in the document. Students will experience the complexity of constructing their own study. They ar
Subjects:
Grades:
10th - 12th, Higher Education, Adult Education
Types:
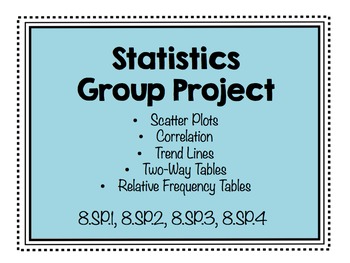
Statistics Group Project (8.SP.1, 8.SP.2, 8.SP.3, 8.SP.4)
This group project assesses student knowledge on the following concepts:
-scatter plots
-correlation
-correlation coefficient (using a calculator)
-trend lines and using trend line equations to predict values
-two-way tables
-two-way tables using relative frequency (total, rows, columns)
-identifying trends in two-way tables
-using two-way tables to answer questions
Included:
-Project instruction sheet for students
-Rubric
-Example project to show students (powerpoint)
-handout on using a calcu
Subjects:
Grades:
8th - 9th
Types:
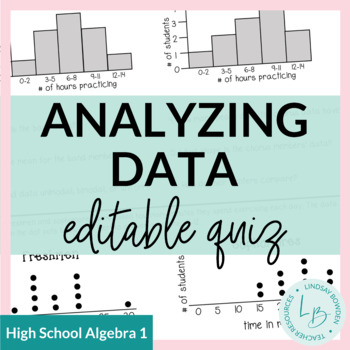
Analyzing Data Quiz
This data analysis quiz includes:comparing data of two sets using histograms, dot plots, and box and whisker plotsshape (symmetrical, skewed right, skewed left)center (mean, median)peaks (mode)spread (MAD, IQR)analyzing what these factors mean in context of the problem2 pages + answer key!Click here to see the digital version of this quiz available for Google Drive™. You may also like:Data Analysis Notes and WorksheetsScatter Plots Notes and WorksheetsStatistics StationsThis quiz is editable!! T
Subjects:
Grades:
8th - 10th
Types:
CCSS:
Also included in: Statistics Unit Bundle
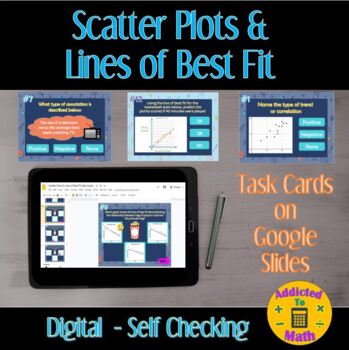
Digital Scatter Plot & Line of Best Fit Self-Checking Activity on Google Slides
This is a fun, interactive, self-checking progressive google slide activity on scatter plots and lines of best fit. Sample topics include naming the type of correlation, writing the equation for the line of best fit, and making predictions. There are 12 questions total.When a student chooses the wrong answer they will see an "X" appear. When students click and choose the correct answer they will see a smiley face appear.This activity is perfect for distance learning, small groups, and independen
Subjects:
Grades:
8th - 12th
Types:
Also included in: Digital Scatter Plot & Line of Best Fit Activity BUNDLE #2
Showing 1-24 of 873 results


