177 results
Free statistics assessments
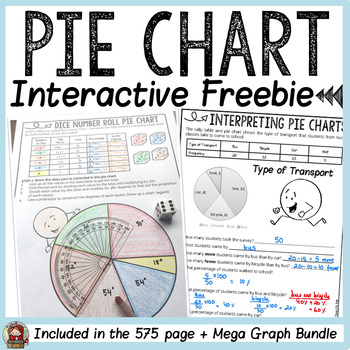
PIE CHARTS/ PIE GRAPHS/ CIRCLE GRAPHS FREEBIE
This freebie on interpreting and creating a pie chart is a sampler activity from the Mega Graphs Bundle.ITEMS INCLUDED✅ A poster defining a Pie Chart.✅ A one-page activity sheet to interpret collated data on mode of transport to school.✅ A one-page activity sheet that requires students to roll a dice and collect and interpret data. They will also find the percent and proportion of each sector to construct a pie chart using a protractor.✅ Answer key/completed sample of each graphing activity.****
Subjects:
Grades:
2nd - 6th
Types:
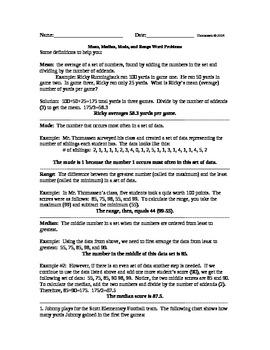
Mean Median Mode and Range Word Problems FREE
These free mean, median, mode, and range word problems (10 problems in a total of 20 pages with the definition overview and answer key) combine silly names and teacher-created data for the students to work with. Also, the beginning provides a quick definition overview of how to solve mean, median, mode, and range. This organizer provides a great amount of space for students to show their work. Don’t forget to peruse my other resources for Mean, Median, Mode, and Range. Thank you!
Subjects:
Grades:
5th
Types:
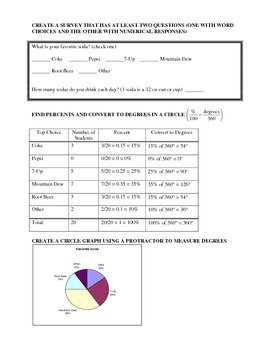
Construct a Survey Lesson/Project Plan
This PDF document consists of three parts: a lesson plan, project instructions, and a grading rubric. The lesson has students construct a survey that will have at least two questions: one that is multiple choice and one that has a numerical answer. It can either be an individual assignment or a group assignment and takes 2-3 days. I used this towards the end of the year as a review exercise since it covers multiple concepts: percents, circle graphs, central tendency (with outliers), box-and-whis
Subjects:
Grades:
6th - 9th
Types:
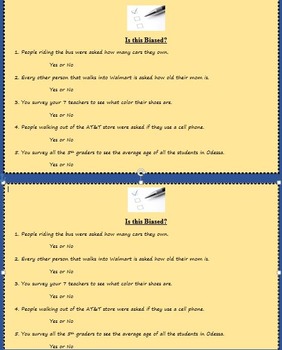
Is this Biased? (populations and random samples)
This is a 5 question quiz, exit ticket, do now, or homework assignment that reviews how surveys and samples can be biased sometimes. All 5 can be answered with a yes or no for whether it is indeed a biased survey. Enjoy and please rate and/or comment on this product!
Subjects:
Grades:
5th - 9th
Types:
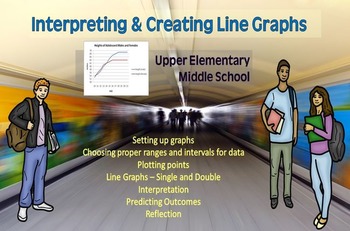
INTERPRETING AND CREATING LINE GRAPHS
Are you looking for a quick way to assess your students' mastery of double line graphs? Here it is! This can be used to practice creating double line graphs or to determine previous learning. It is ready to go! I would use it in all middle school grades maybe even lower if students are ready! This activity could also be changed to practice double bar graphs, if you want to extend the learning. It could also be used for substitute work in upper grades. It is a great way to teach creating graphs i
Subjects:
Grades:
5th - 8th
Types:
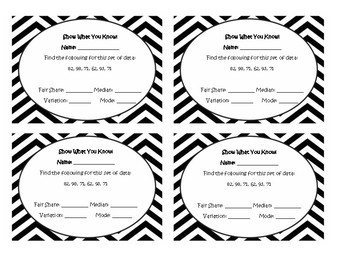
FREEBIE Mean Median Mode and Range Exit Slip
This exit/entrance ticket freebie is a quick check for understanding on finding the mean, median, mode and range of data. It uses vocabulary words like "fair share" for the mean and "variation" for the range in alignment with the Virginia SOL 5.16.
All exit slip template/background credits and copyright go to Alina Veja at https://www.teacherspayteachers.com/Store/Alina-Veja. Go check out her store for more info!
Subjects:
Grades:
4th - 6th
Types:
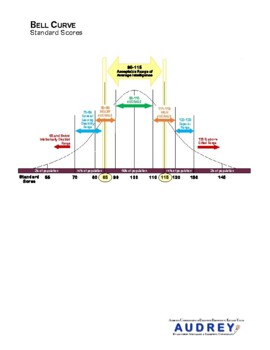
Special Education Evaluation Bell Curve SpEd Evaluation Diagnostician
Graphic to help explain standard scores to parents. See my other listings with the full version that contains information for parents.
Subjects:
Grades:
Not Grade Specific
Types:

Mean, Median, Range, Mode Quiz
This is a five problem math quiz. It can be used for a quiz, but also as a review. There are five sets of numbers where students must find the mean, median, range, and mode of each data set. The numbers are not in numerical order.
Subjects:
Grades:
3rd - 8th
Types:
Interquartile Range (IQR) & Box-and-Whisker Plot Review
This is a half sheet document with four questions to review both interquartile range and box-and-whisker plots. Can be used in an interactive notebook or as an exit ticket.No teacher prep for one page in an interactive notebook! Or you may use it as a quick exit ticket at the end of a class period. Very flexible with how you want to use the four questions. Save paper with the one sheet to two students ratio!Answer key is included for all four problems.I want to improve my products. If you have a
Subjects:
Grades:
6th - 9th
IEP Tips and Testing Terms Defined - Free Chart
IEP Tips and Testing Terms Defined for Parents Free Chart: This freebie includes a page of tips for running a successful IEP meeting and another page that is a chart with the normal bell curve that defines different types of test scores. The scores defined are standard scores, stanines, percentile ranks, standard deviation, grade equivalents, age equivalents and composite scores. If you’d like to create your own chart like this check out my normal bell curve clipart package here!
You might al
Grades:
Staff
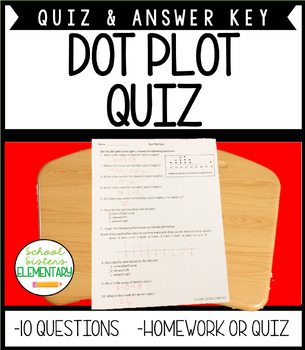
Dot Plot Quiz
6th grade math print and go quiz and answer key on dot plot graphs There are 10 questions. The topics are✅ Reading dot plots✅ Creating dot plots✅ Evaluating dot plotsWhat other teachers have said:⭐⭐⭐⭐⭐ My students and I loved this! Thank you!⭐⭐⭐⭐⭐ I am so grateful to find this amazing product. Highly recommend! If you are interested in improving engagement in your classroom this year, check out these resources:6th Grade Math Quiz Bundle6th Grade Math Vocabulary CardsDividing Fractions with Mode
Subjects:
Grades:
5th - 7th
Types:
Also included in: 6th Grade Data Quiz Bundle
- EXTRAIT - Le cycle d'une plante FRENCH SCIENCE ACTIVITY
Ce document est un extrait d'un document de 23 pages. L'extrait suivant contient 5 pages. Il porte sur le cycle d'une plante. Vous y trouverez deux pages avec des mots-étiquettes des étapes du cycle d'une plante ainsi qu'une évaluation en lien avec la notion.
CLIQUEZ ICI POUR ACCÉDER AU DOCUMENT ORIGINAL COMPLET.
Le document complet contient :
- la description du projet,
- les mots-étiquettes des étapes du cycle d'une plante,
- un cahier de l'élève de 11 pages (mise en situation, hypothèse,
Subjects:
Grades:
3rd - 4th
Types:
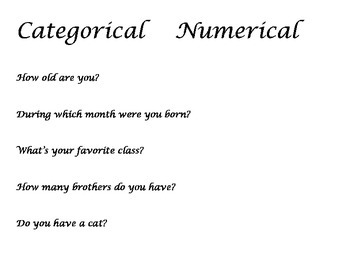
Data Question Types Sort: Categorical or Numerical
(Almost) no prep sorting activity for students to practice identifying if a statistical question is referring to numerical or categorical data. Simply print, copy, cut, and set out. Could be used as a stations-type activity, a formative assessment, partner work, cooperative group work, or a springboard for a discussion on data types.
Subjects:
Grades:
5th - 7th
Types:
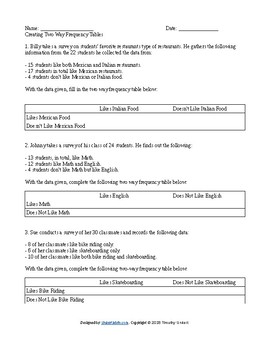
FREE Two-Way Frequency Tables Worksheet! (HSS.CP.A.4)
In this FREE worksheet students tackle 6 problems where they must complete (fill in) empty two-way frequency tables. Can be used as a worksheet, homework, or as an assessment! Answer key included. Aligns with Common Core Standard HSS.CP.A.4. Four pages total including answer key.
Subjects:
Grades:
8th - 10th
Types:
CCSS:
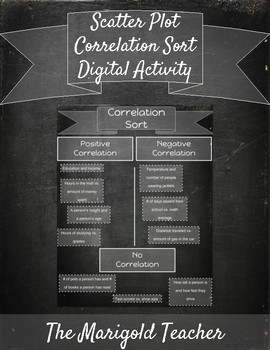
Scatter Plot Correlation Sort Digital Activity
This activity requires students to sort scenarios into either positive, negative, or no correlation. It can be used as either a bellwork, practice activity, or an exit ticket. This product can be downloaded and used digitally using drag and drop in Google Slides. It can also be printed where students will cut and glue the scenarios into the appropriate correlation.. I have used this activity within a digital interactive notebook as a practice activity and it worked really well.
Subjects:
Grades:
6th - 8th
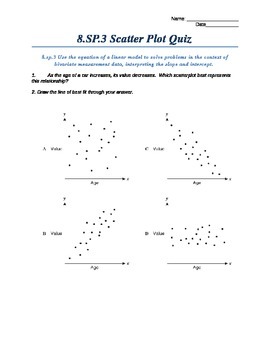
CCSS 8.SP.3 Scatter Plot Quiz
This quiz will assess if students can correctly place a line of best fit and interpret a line of best fit, understanding the meaning of the slope and intercept.
Subjects:
Grades:
8th
Types:
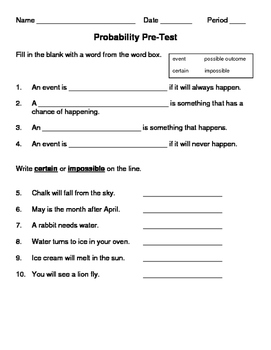
Probability Pre-Test
If you are about to begin a unit on probability with your middle schoolers, this pre-test is for you!
This diagnostic assessment will let you know how much background knowledge your students have regarding probability and chance!
Subjects:
Grades:
6th - 8th
Types:
Mean, Median, Mode and Range: Who Am I? Test Review Powerpoint
Who Am I? Mean, Median, Mode or Range? Or am I more than one? Let's find out!
This free PowerPoint resource is perfect for a formative assessment at the end of a lesson, or could even be used as an opener with 2 questions per day for a week!
Students will be required to know which measures are of center, which one is of variation and real-life situations where they are used. This is editable as well, so feel free to add on to it!
Subjects:
Grades:
4th - 5th
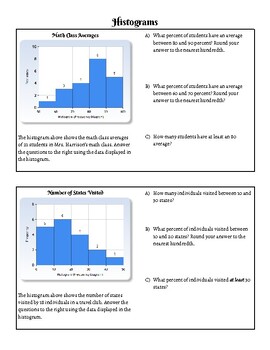
Histogram Practice Sheet
Aligned to the Algebra 1 NYS Next Gen Learning Standards- NY-6.SP4: Display quantitative data in plots on a number line, including dot plots, and histograms.This is a practice sheet to help students master histograms. Students will interpret the data from two histograms, and then construct their own histogram to represent a set of data. Designed to take about 20 minutes to complete
Subjects:
Grades:
Not Grade Specific
Types:
CCSS:
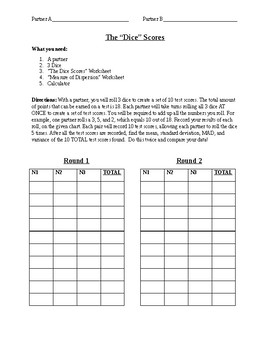
Dice Activity for Standard Deviation
This is a great activity that helps the students understand standard deviation! With a partner, the students will roll 3 dice to create a set of 10 test scores. The total amount of points that can be earned on a test is 18. Each partner will take turns rolling all 3 dice AT ONCE to create a set of test scores. They must add up all the numbers they roll. For example, one partner rolls a 3, 5, and 2, which equals 10 out of 18. Record your results of each roll, on the given chart. Each pair will r
Subjects:
Grades:
7th - 12th
Types:
CCSS:
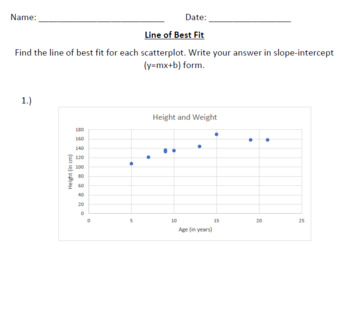
Line of Best Fit Practice
Every practice I have seen for line of best fit asks students to create the scatter plot and then find the line of best fit. However, this takes significantly longer. I created these scatter plots to give students a chance to focus specifically on creating a line of best fit and finding the slope-intercept equation of the line. I have attached the PDF and Word version (for editing), as well as an answer key. Please keep in mind that answer may differ depending on which points are chosen to calcu
Subjects:
Grades:
7th - 9th
Types:
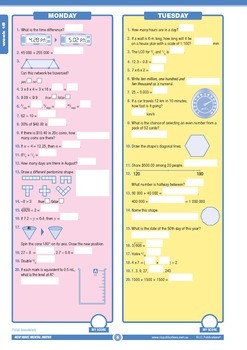
Mental Maths Workbook Year 7 - Australian Curriculum Aligned
Provide your students with daily practice and watch their mental recall, maths knowledge and understanding, and problem-solving skills improve. Day-by-day activities cover all mathematics strands and are developmental throughout each book and the series. Supported by a weekly testing program (levels D-G), New Wave Mental Maths is the complete mental mathematics resource.
Free Trial Booklet Download. Follow this link to view the full book: New wave mental maths workbooks
Subjects:
Grades:
6th - 8th
Types:
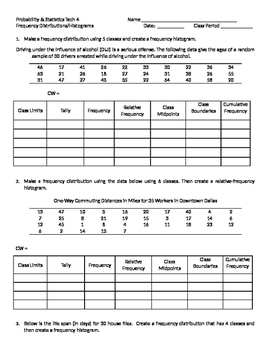
Frequency Distributions Practice
This worksheet gives students practice on making frequency distribution tables. I used this same sheet in my Prob & Stats class, and we also used the same tables to make frequency and relative frequency histogram, frequency polygons, and cumulative ogive graphs.
Subjects:
Grades:
10th - 12th
Types:

Data and Graph INB(Box plot, Line plot, Histogram, Frequency table, Stem n Leaf
A great introduction to graphing and data to work through each type of graph together using the data given or data from the students in the class. My class enjoys this assignment from our Interactive Notebook.
Subjects:
Grades:
5th - 8th
Types:
Showing 1-24 of 177 results


