38 results
Free 4th grade statistics assessments
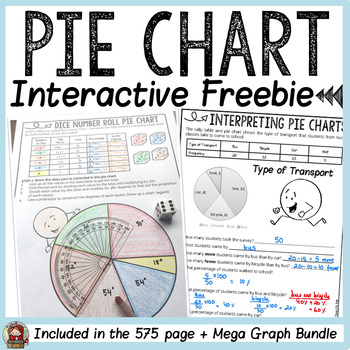
PIE CHARTS/ PIE GRAPHS/ CIRCLE GRAPHS FREEBIE
This freebie on interpreting and creating a pie chart is a sampler activity from the Mega Graphs Bundle.ITEMS INCLUDED✅ A poster defining a Pie Chart.✅ A one-page activity sheet to interpret collated data on mode of transport to school.✅ A one-page activity sheet that requires students to roll a dice and collect and interpret data. They will also find the percent and proportion of each sector to construct a pie chart using a protractor.✅ Answer key/completed sample of each graphing activity.****
Subjects:
Grades:
2nd - 6th
Types:
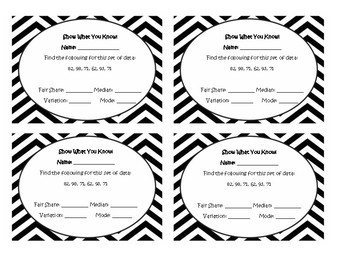
FREEBIE Mean Median Mode and Range Exit Slip
This exit/entrance ticket freebie is a quick check for understanding on finding the mean, median, mode and range of data. It uses vocabulary words like "fair share" for the mean and "variation" for the range in alignment with the Virginia SOL 5.16.
All exit slip template/background credits and copyright go to Alina Veja at https://www.teacherspayteachers.com/Store/Alina-Veja. Go check out her store for more info!
Subjects:
Grades:
4th - 6th
Types:

Mean, Median, Range, Mode Quiz
This is a five problem math quiz. It can be used for a quiz, but also as a review. There are five sets of numbers where students must find the mean, median, range, and mode of each data set. The numbers are not in numerical order.
Subjects:
Grades:
3rd - 8th
Types:
- EXTRAIT - Le cycle d'une plante FRENCH SCIENCE ACTIVITY
Ce document est un extrait d'un document de 23 pages. L'extrait suivant contient 5 pages. Il porte sur le cycle d'une plante. Vous y trouverez deux pages avec des mots-étiquettes des étapes du cycle d'une plante ainsi qu'une évaluation en lien avec la notion.
CLIQUEZ ICI POUR ACCÉDER AU DOCUMENT ORIGINAL COMPLET.
Le document complet contient :
- la description du projet,
- les mots-étiquettes des étapes du cycle d'une plante,
- un cahier de l'élève de 11 pages (mise en situation, hypothèse,
Subjects:
Grades:
3rd - 4th
Types:

Mean, Median, Mode and Range: Who Am I? Test Review Powerpoint
Who Am I? Mean, Median, Mode or Range? Or am I more than one? Let's find out!
This free PowerPoint resource is perfect for a formative assessment at the end of a lesson, or could even be used as an opener with 2 questions per day for a week!
Students will be required to know which measures are of center, which one is of variation and real-life situations where they are used. This is editable as well, so feel free to add on to it!
Subjects:
Grades:
4th - 5th
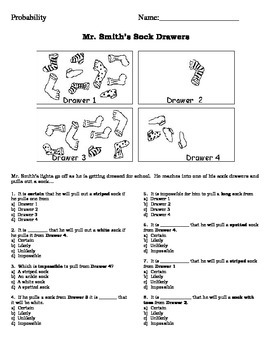
Probability Socks
Two worksheets that assess the students' understanding of probability as both words (certain/likely/unlikely/impossible) and fractions/ratios. The first worksheet asks questions in multiple-choice format. The second asks students to create drawings that illustrate probability meeting rules set forth on the worksheet.
Subjects:
Grades:
4th
Types:
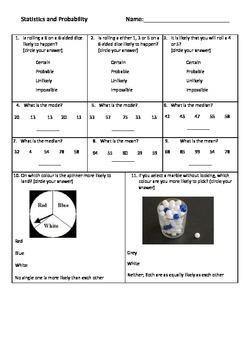
Stats and Probability Pre Test
Mean, Medium, Mode and Range, Chance and Probability
Subjects:
Grades:
3rd - 8th
Types:
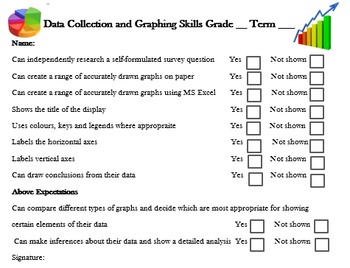
Graph and Data Assessment Checklist & Rubric
Short and quick-to-mark assessment rubric and checklist for graphing tasks suitable for students from grades 2 to 6.
You may also like:
-Comprehensive Multiplication Unit for free
- All Materials Maths units, just click on my store logo to view the full range.
Full set of Maths Assessments:
- Place Value Assessment
- Addition Assessment
- Subtraction Assessment
- Multiplication Assessment
- Division Assessment
- Fractions/Decimals Assessment
Subjects:
Grades:
2nd - 6th
Types:

Mean Median Mode Range Vocabulary Memory Game with Exit Slip
- memory game that uses mean, median, mode, and range as the vocabulary words to practice memorizing the definitions
- students are also matching the example with the word
- can be used in a math center
- can be used for interactive notebooks and flip books
- Exit Slip can be used as formative assessment at end of the class
Subjects:
Grades:
3rd - 7th
Types:
Probability Task Cards
This a set of 36 questions that give students practice in expressing probability events using appropriate vocabulary and fractions.
Subjects:
Grades:
4th - 5th
Types:
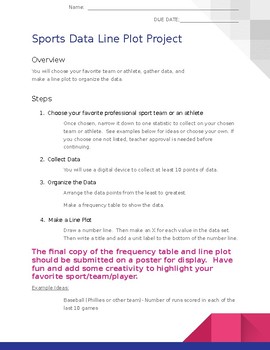
Sports statistics Line Plot Project
Can be used with 5th grade Envisions math program topic 14 as a project and/or end of topic assessment. This is editable so you can tailor it to meet your needs. Rubric included.
Subjects:
Grades:
4th - 6th
Types:

Real Hoops, Real Math
This is a worksheet made for students grades 4-8. It gives individuals a chance to improve their skills in data analysis and graph creation by providing REAL-LIFE NBA statistics. There are 11 QUESTIONS, which have been created to ensure the understanding of tables, statistics, decimals, percentages, averages, and ratios. It could make for a great assessment, as well as good homework with the option to have individuals extend research and stay up-to-date with basketball statistics.
Subjects:
Grades:
3rd - 8th
Types:

Tally Charts, Frequency Charts, & Line Plots
Graphs & Charts are becoming more important in daily life and students need to understand how to read, make, and intrepret them. This is a basic worksheet that aids students in making each of these charts, teacher direction is needed to go over basic concepts of each type of graph & chart. This worksheet can be adapted to fit different students' needs or life experiences. This could also be used as an assessment to see if students truly understand how to create each type of chart or grap
Subjects:
Grades:
4th - 6th
Types:
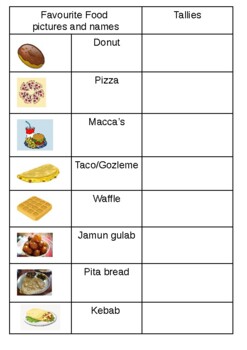
Maths - Data representation - favourite food pictograph activity cut and paste
Australian (Victorian Curriculum Year 1 and 2 levels), Maths - statistics and probability - Gathering data in a pictograph, modelling with class p.1, and task p. 2-4.Page 1 can be used as a teacher model and class data collection and pages 2-4 is the task for students that may use this for cut and paste activity to represent data using pictures for a pictograph. Foods are relatable to students of all countries.
Subjects:
Grades:
PreK - 4th
Types:
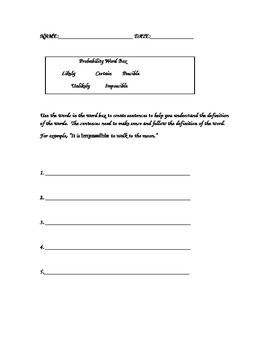
Math Sentences using Probability Terms
After learning the definitions of common probability terms, certain, possible, likely, unlikely and impossible, students will be asked to write sentence using the terms. This exercise can be used as part of a math station, as math homework or as an extension.
Subjects:
Grades:
2nd - 4th
Types:
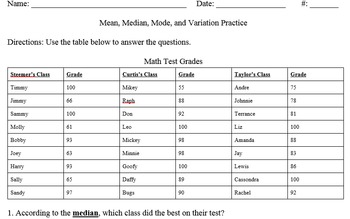
Statistics Notes and Worksheets
These are the notes and worksheets, as well as unit guides, study guides, test review, etc. for the Statistics Unit in 5th grade. It covers topics like mean, median, mode, range, line graphs, stem-and-leaf plots, etc. They were created with Virginia standards (SOLs) in mind, but would cover most 5th grade Common Core objectives too. These do not include the actual lesson plan; they are just documents you could include in your lesson to teach these concepts.[These free plans do not incorporate th
Subjects:
Grades:
4th - 6th
Types:
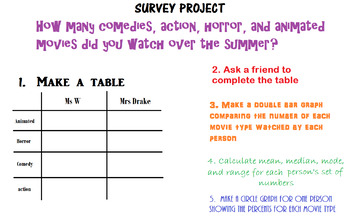
Statistics Survey Project
These are student instructions for a survey and data project. Students need to collect, record, analyze, and display data.
Subjects:
Grades:
4th - 8th
Types:
5th Grade Data Management Quizzes
5th Grade Data Management Quizzes- 22 pagesIf you're looking for 5th grade data management quizzes that require zero prep and are ready to print and handout to your class, then you need to take a look at these data management quizzes for grade 5.Includes quizzes on scale, trend, range, bar graphs, circle graphs or pie graphs, broken-line graphs, line graphs, pictographs and more...BENEFITS OF THIS RESOURCE:No PrepWorks on any deviceSelf-gradingGreat for Distance LearningImmediate FeedbackDetaile
Subjects:
Grades:
4th - 5th
Types:
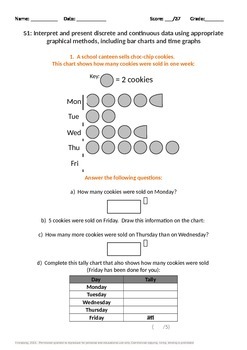
Statistics: Handling Data
Assessment for interpreting data including pictograms, bar charts, time graphs etc. Free mark scheme can be downloaded for all assessments including this one.
Subjects:
Grades:
2nd - 5th
Types:

Grade 4 Probability Game Challenge
This fun, quick assignment lets student be creative and design a game of chance under their rules. There is a success criteria check-bric included not a formal rubric. It is designed to be used with the Ontario 2020 Grade 4 math curriculum.
Subjects:
Grades:
4th - 5th
Types:
Also included in: Probability Bundle- 2020 Curriculum Ontario
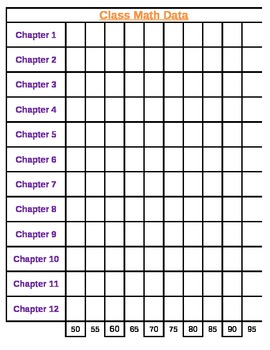
Math Class Data Sheet
Great for a class Data Wall!
This is an excel spreadsheet used to track yearly growth.
Enjoy!
Subjects:
Grades:
K - 12th
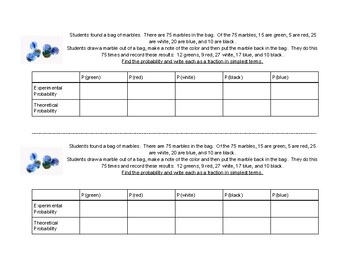
Probability Exit Ticket
Exit ticket comparing theoretical and experimental probability.
Subjects:
Grades:
4th - 9th
Types:
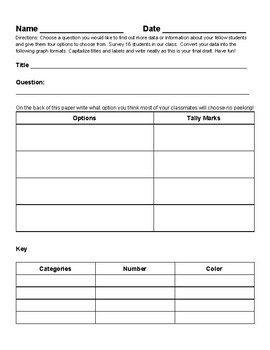
Survey Data Graph Project
Students will be able to survey fellow classmates using tally marks then turn their data into horizontal and vertical bar graphs, picture graph, line plot, and a pie chart (circle graph). I have used varied terminology on multiple charts as the vocabulary is different on various assessments.
Subjects:
Grades:
2nd - 4th
Types:
CCSS:
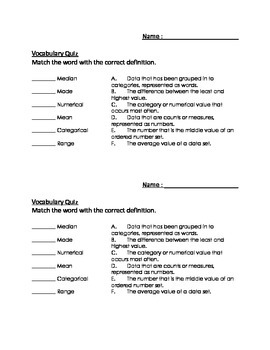
Basic Data Terms Vocab Quiz
Quick and simple basic terms of data analysis matching quiz. Includes 6 basic data terms (categorical, numerical, mean, median, mode, range) and a definition for each. Each quiz is a half sheet of paper, and an answer key is included.
Subjects:
Grades:
4th - 7th
Types:
Showing 1-24 of 38 results


