48 results
High school statistics research under $5
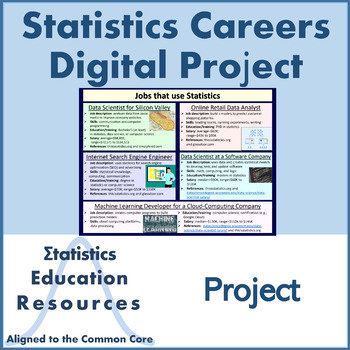
Careers in Statistics Digital Project
Distance Learning: Careers in Statistics Project Students complete this project by researching careers in statistics and creating a digital report. They select five careers and summarize their characteristics including job description, required skills (such as how statistics are used), education/training, and salary. Students may elect to create a digital poster (EDITABLE 24-inch by 18-inch template in PPTX included) or a short video report. Only want to assign a digital poster or only want vid
Subjects:
Grades:
9th - 12th
Types:
Also included in: Bundle: Algebra I Statistics Activities (Common Core Aligned)
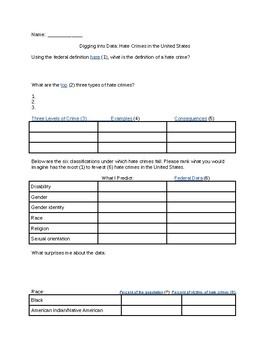
The 57 Bus- Looking at Hate Crime Data
A guided web search on hate crime data from the FBI, CDC, Pew Research Center, and U.S. Census Bureau. Uses reflection questions to make conclusions and predictions about the distribution of hate crimes. The kids are fascinated by the data!
Subjects:
Grades:
7th - 12th, Higher Education, Adult Education
Types:
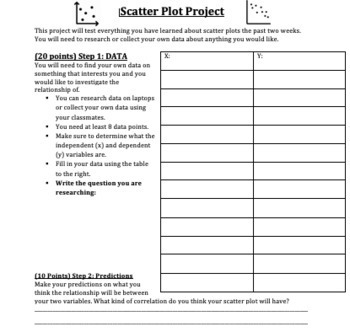
Scatter Plot Project
This is an awesome research project that is summative assessment for a Scatter Plot unit. For this project students are asked to pick a research question about bivariate data, gather the data online or through a survey. Next, they will make a prediction, construct a scatter plot, draw a line of best fit, find the equation of a line of best fit, and answer analytical questions about the data by interpreting the scatter plot. This is a great project that will allow students to utilize technology t
Subjects:
Grades:
7th - 10th
Types:
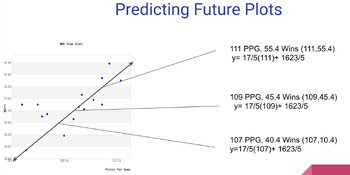
Scatter Plot Project on Desmos with Template
Learners will work to collect their own data from something they are interested in. They will then create a scatter plot using Desmos.com and analyze the information they collected. The analysis includes drawing their own trend line, finding the equation of that trend line, and predicting 3 values outside their original data collection. There are detailed directions with screenshots included along with a Google Slides template that can be shared with learners to help them organize their work. I
Subjects:
Grades:
7th - 9th
Types:
Collecting & Analyzing Data Project | Line of Best Fit | Correlation Coefficient
Give your students some practical, real-world experience with this data-analyzing project. Things to know: 1. Prior to completing this project, students must be somewhat familiar with scatter plots, lines of best fit, correlation coefficients, and data displays. 2. This project will require collecting data via surveys. 3. Great group projects. 4. Allows for students to be creative and look for correlations between things they are interested in.
Subjects:
Grades:
8th - 10th
CCSS:
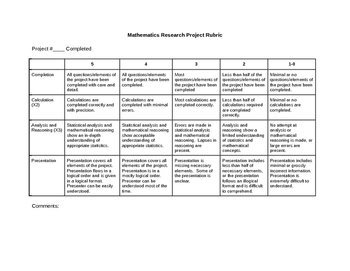
Math or Statistics Research Project Rubric
This editable rubric contains fields for project completion, calculation, analysis and reasoning, and presentation on a scale of five to one. It was originally designed for the Alberta Math 20-2 mathematics research project requirement, but is suitable for use across junior and senior high.
Subjects:
Grades:
9th - 11th
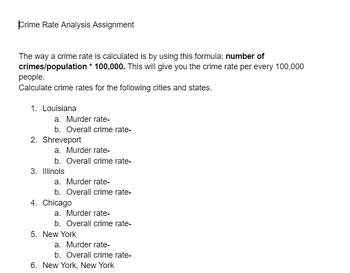
Crime Rate Analysis Assignment
A web based assignment to allow students to calculate the crime rates of various U.S. cities.
Grades:
5th - 12th, Higher Education, Adult Education
Types:

Creating Surveys and Analyzing Data, In-Class Activity
This activity walks students through the process of creating a survey, collecting results, and analyzing data. It is an assignment that can be done independently by students in class. Students that have any difficulty should be able to easily get assistance from fellow students. Rather than simply learning the terminology that comes with surveys and collecting research data, the student will use critical thinking to create and analyze their own surveys.
Subjects:
Grades:
10th - 12th, Higher Education
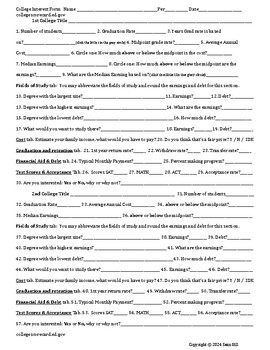
College Interest Form (College Research Unit 1st Lesson)
This is an excellent Introduction to college research. If your school is college focused or you just need a interested based activity to get the students engaged, this is an intriguing assignment that gets kids curious about different colleges and their stats. Did you know that the federal government compiles all the FAFSA data? It keeps track of how much money each person who filled out a FAFSA makes over the long term (10 years+). There is a wealth of data on every college that has ever accept
Subjects:
Grades:
6th - 12th
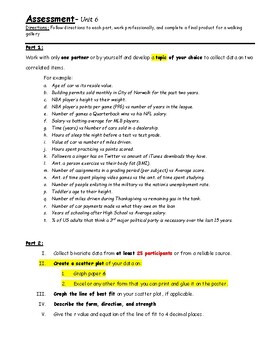
Assessment - Performance Task - Bivariate Data Research
IB Applications & Interpretations SL: End-of-Unit 6 Assessment - Bivariate Data Research Performance Task. Students work in pairs to collect data on two correlated items. After collecting data from 25 participants, students create a scatter plot, line of best fit and analyze the data. Students then perform a gallery walk and answer a series of reflection questions for positive/negative correlation, and zero correlation. Example and grading rubric included
Subjects:
Grades:
10th - 12th
Types:
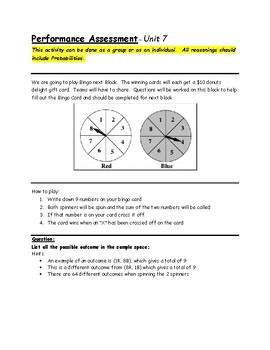
Assessment - Performance Task - Bingo Exploration
IB Applications & Interpretations SL: End-of-Unit Assessment performance task to create bingo cards by analyzing probabilities of numbers that are likely to be selected. Students will then compete in a bingo competition
Subjects:
Grades:
10th - 12th
Types:
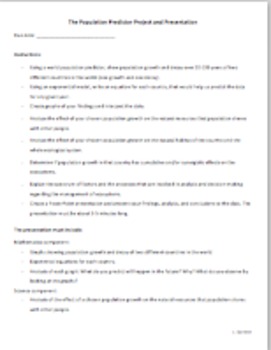
Population Predictor Project (Exponential Functions & Calculator Regressions)
This is an interdisciplinary project for math and science, where students analyze real-life applications of exponential functions.Using an online world population predictor, students will research population growth and decay over 50-100 years of two different countries in the world (one growth and one decay). Then, using an exponential model, they will write equations (algebraically) that would help them predict the data for any given year, for each country. They will create and analyze graphs,
Subjects:
Grades:
9th - 12th
Also included in: Math in the Real World Projects Bundle
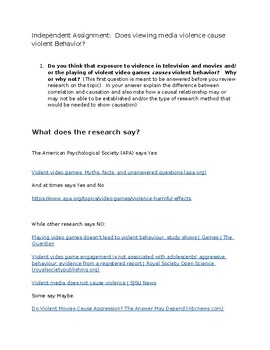
Does viewing media violence cause violent behavior? What does the research say?
This product asks students to weigh in on the possible causal connection between exposure to violent media and violent behavior. Students are asked to state their thoughts both prior to and after reviewing the existing literature on the topic. Research articles present arguments both affirming and denying the causal connection. Multiple meta-analysis article links are also provided. Students are asked to note if their stance on the issue changed after viewing the research and to explain why
Subjects:
Grades:
9th - 12th, Higher Education, Adult Education
Types:
Analyzing Mario Kart: A Statistical Journey through Racing Fun
In this AP Statistics project, we will delve into the world of Mario Kart and apply statistical analysis to gain insights into the game mechanics and player performance.The objective of this project is to explore different statistical concepts and techniques while using data from Mario Kart races. We will investigate factors that may influence race outcomes, such as character selection, track features, and player skill level. Through data analysis and hypothesis testing, we will uncover patterns
Subjects:
Grades:
11th - 12th
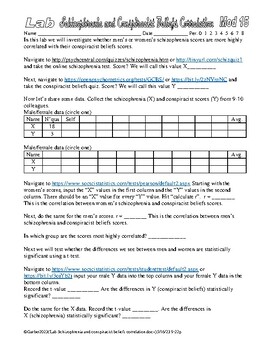
Psychology Schizophrenia and Conspiracist Beliefs Scores Correlation Statistics
In this lab we are finding out if men’s or women’s schizophrenia and conspiracist belief scores are more highly correlated.Students do the schizophrenia quizzes and conspiracist beliefs quiz, collaborate and share data then use a website to conduct the data analysis. It is inspired by this collection… https://www.teacherspayteachers.com/Product/Psychology-Lab-Trolley-Problem-Psychopathy-Scores-Correlation-Statistics-9499523 and the other correlation stuff I have set up…(I have a bunch, these are
Subjects:
Grades:
9th - 12th, Adult Education
Types:
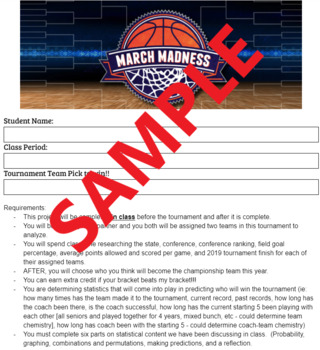
March Madness Statistics Project
High School and Middle School Statistics Class Project. March Madness is played by an estimated 25 to 30 million people each year and in this project our students will be part of the action! Don't worry, if you don't know one thing about basketball you will do fine with this project! Each student will become an researcher and pick two teams to win the tournament! Requirements:This project will be completed in class before the tournament and after it is complete.You will be able to pick a partne
Subjects:
Grades:
9th - 12th, Higher Education
Types:
AP Psychology - ACTIVITY - Memory - Dual-Processing
Conduct a study with your class to illustrate how dual-processing impacts encoding of memories. A fun activity to start off the 1.1 Introduction to Psychology topic, or to throw into the mix of Unit 5. Cognitive PsychologyThis activity is easy to implement and comes with detailed instructions.Approximately 10-15 minutes from start to finish.1. Half the class are in the control condition (listening), the other in the experimental condition (listening and visualizing). 2. After collating the resul
Subjects:
Grades:
9th - 12th
Types:
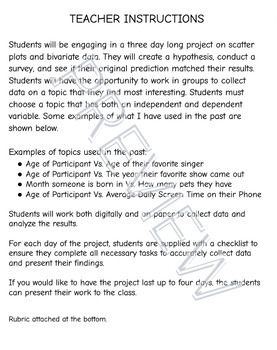
Scatter Plot and Bivariate Data Project
Students will be engaging in a three day long project on scatter plots and bivariate data. They will create a hypothesis, conduct a survey, and see if their original prediction matched their results. Students will have the opportunity to work in groups to collect data on a topic that they find most interesting. Rubric attached at the bottom.
Subjects:
Grades:
6th - 12th
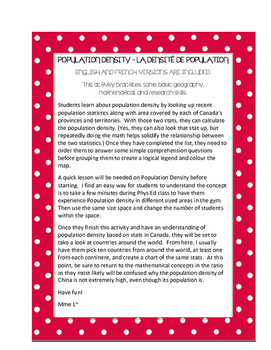
Population density - La densité de population
POPULATION DENSITY – LA DENSITÉ DE POPULATION
ENGLISH AND FRENCH VERSIONS ARE INCLUDED.
This activity practices some basic geography, mathematical, and research skills.
Warm-up to the idea with an experiential activity in the gym, then tackle the concept of Population Density. Students learn about population density by looking up recent population statistics along with area covered by each of Canada’s provinces and territories.
Subjects:
Grades:
7th - 10th
Types:
Primary and Secondary Data
This lesson is the lesson after "Samples and Populations". This lesson has the content included and will allow students to engage in a research project as they discover the different methods included in Samples and Populations. This lesson supports the textbook "Maths Quest 8".
The resources that you will also need for this lesson is butchers paper and marker pens.
Subjects:
Grades:
7th - 9th
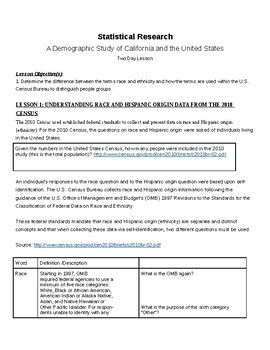
SAT Prep: Charts, Tables, and Graphs using U.S. Census Data Study
This lesson uses data from the 2010 U.S. Census to allow students to access numbers and data in a social science classroom. The lesson is a 2 day mini-unit centered on working with charts, graphs, and tables (serves extremely well for SAT and ACT prep). This cross-curricular lesson draws meaningful parallels between math and social science, and the necessity of bringing these subjects together. The lesson uses a comparative look at Census data for California and the United States as a whole, but
Subjects:
Grades:
9th - 12th
Types:
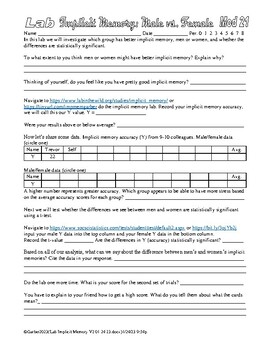
Psychology Lab Implicit Memory Test Cognition Statistics AP Psychology
I did a complete revision of this lab, the old website died. It is now a hard copy. In this lab the students navigate to https://www.labinthewild.org/studies/implicit_memory/ and do the implicit memory activity. They then collaborate to share data and perform a t-test to find out if the difference between male and female scores is statistically significant. You have managed to find the source of the best Psychology and AP Psychology labs on TPT, go check out my store for other awesome resources
Subjects:
Grades:
9th - 12th, Higher Education
Types:
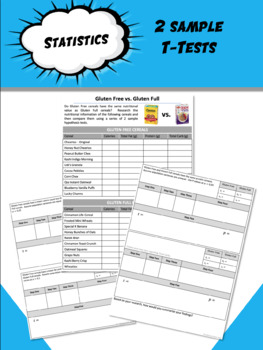
Gluten Free v Gluten Full--2 Sample T Tests
This is math in the REAL WORLD! Part one: Collect DataThe quality and integrity of statistics rests upon the accuracy of your dataPart two: Analyze DataStudents compare Calories, Protein Content, and Fat using 2-sample t-tests. Part Three: Create Your OwnIt's important for students to create and analyze their own research questions, so this give them a chance to come up with a question regarding the Carb content of cereals. *Model answer key is included, but data can vary!
Subjects:
Grades:
10th - 12th, Higher Education, Adult Education
Types:
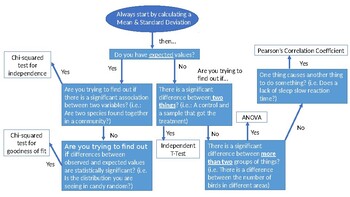
IB Biology: Internal Assessment Statistical Analysis Decision Tree
This product is a PowerPoint slide that can be modified to meet your needs and saved as a PDF to digitally provide to students. I had noticed that my students struggled with determining which statistical analysis was most appropriate for their Internal Assessment, so I created a decision tree for them. By being able to answer the questions on the decision tree, they will be able to appropriately analyze their data and reach their conclusion.
Subjects:
Grades:
11th - 12th, Higher Education, Adult Education
Showing 1-24 of 48 results


