Excel Projects for Statistics Frequency Distributions and Charts
Math Luvr
69 Followers
Grade Levels
8th - 11th, Higher Education, Adult Education
Subjects
Resource Type
Formats Included
- Zip
- Excel Spreadsheets
Pages
11 pages
Math Luvr
69 Followers
Description
This file contains three different projects with solutions and a quick reference card for students. It correlates to Bluman's Elementary Statistics textbook.
First is an Introduction to Excel. There is an example, guided practice and then 4 Projects. The instructions are on each sheet. The topics covered are: basic editing and formatting, beginning charts, beginning formulas, such as SUM and AVERAGE, and calculations. There is an editable grading rubric for this project. The Preview file was a pdf taken from the Excel Solution file.
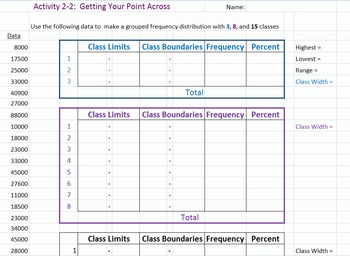
Second Activity - correlates to section 2-2 - creating a frequency distribution. This includes the COUNTIFS formula for finding the frequency, as well as, reinforcing how to find boundaries and class widths. There is a detailed instruction sheet, as well as a solution file for this activity. (Thumbnails)
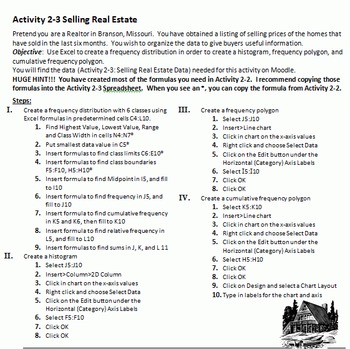
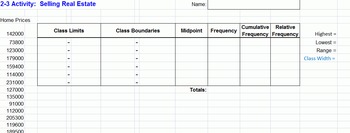
Third Activity - correlates to section 2-3 - creating different types of charts to display data. On this activity, students are asked to complete a histogram, frequency polygon, and cumulative frequency polygon (ogive). There is an editable detailed instruction sheet with some questions for this activity. There is a solution file as well, for this activity. (Thumbnails)
Total Pages
11 pages
Answer Key
Included
Teaching Duration
1 Week
Report this resource to TPT
Reported resources will be reviewed by our team. Report this resource to let us know if this resource violates TPT’s content guidelines.


