17 results
2nd grade statistics projects
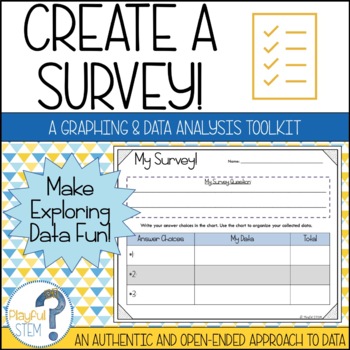
Create Your Own Survey: Collect, Organize, Graph, and Analyze Data
One of my best-selling TPT products -- now updated with a fresh look and new content!Teach Data Analysis the open-ended and engaging way -- through student-directed surveys!This resource pack is designed to help students follow the process of creating a survey: they will brainstorm questions, collect data, organize their obtained data, create multiple graphs to show their data, and then reflect on and analyze what their data tells them.The survey pack includes the following:Brainstorming Survey
Subjects:
Grades:
2nd - 5th
Types:
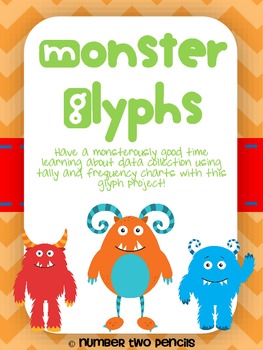
Monster Glyph and Graph
In this monster glyph activity students create a unique glyph while teaching classmates about themselves. Students then use the class glyph to collect and analyze data, creating their own graphs as displays. This project is especially great because its complexity can be easily differentiated across grades and customized for the individual needs of your students.
This work is licensed under a Creative Commons Attribution-NonCommercial-NoDerivs 3.0 Unported License.
Subjects:
Grades:
1st - 4th
Types:
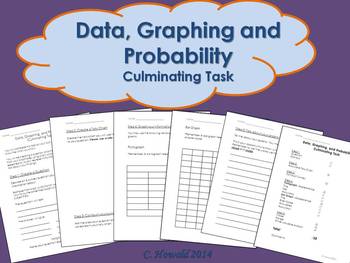
Graphing Unit Culminating Project
I used this activity as a summative assessment for my Data, Graphing and Probability Unit. This gave students the opportunity to create their own question, survey a group of students (visited another class in the school), collect, display and analyze their data.
I have left this as a .doc file so that you are able to adjust it to fit the needs of your classroom.
If you have any questions or concerns, let me know!
Thanks for downloading. Please take the time to rate this product.
If you e
Subjects:
Grades:
2nd - 4th
Types:
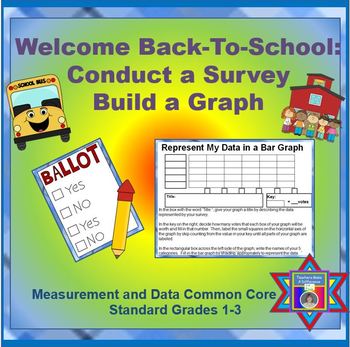
Graphs FREEBIE Back-To-School: Conduct a Survey & Build a Graph (CCSS Aligned)
FREE!!! FREE!!! FREE!!! FREE!!! FREE!!! FREE!!! FREE!!!
PLEASE take time to provide feedback in exchange for the download! I appreciate your time!
I created what I hope to be a fun but helpful resource for your students in Grades 1-3. In return, I ask that you please take time to rate and leave feedback to let others know how the activity worked for you and your students. I appreciate your time and effort!
In Grades 1-3, students are expected to be able to build their own bar
Grades:
1st - 3rd
Types:
Dice game and app with Scratch (Distance Learning)
In these lessons, you will learn how to create a dice game with Scratch. The game is useful as a random number generator. It is useful when teaching randomness and probability. Students learn coding skills. Students learn to create their own dice face with a free online graphics application. Each lesson comes with detailed step by step instructions.
Grades:
2nd - 12th, Higher Education, Adult Education, Staff
Types:
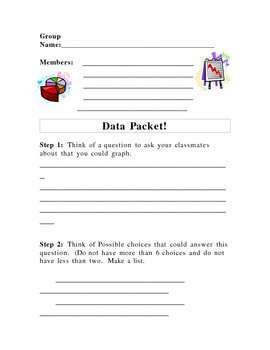
Circle Graph Project
This is a project for pairs or teams of students. They choose a question to graph by coming up with up to 6 possible responses. Then they ask their classmates and turn their answers into a circle graph.
Subjects:
Grades:
2nd - 6th
Types:
Data Inquiry
This data inquiry is designed as an end of unit project for Statistics and Probability (Australian Curriculum). Students work through the inquiry as a group or individually.
Students are asked to show their knowledge of different types of data display and collection. They will need to design an appropriate survey question, conduct the survey and display the results of the survey using a graph.
Included in the pack:
• Step by Step guided inquiry
• Accompanying worksheets
• Marking Rubric
Subjects:
Grades:
2nd - 6th
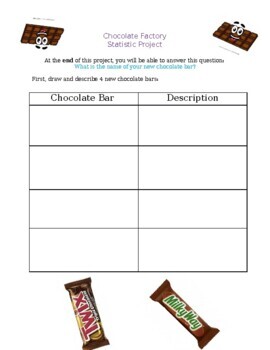
Chocolate Factory Statistics Project with Rubric
Chocolate Factory Statistics and Probability ProjectStudents are to come up with different chocolate bar designs and collect data on which is the most popular.At the end of the project, students can have a go at creating their chocolate bar packaging! Please see the store to see an additional, more comprehensive rubric.
Subjects:
Grades:
1st - 3rd
Types:
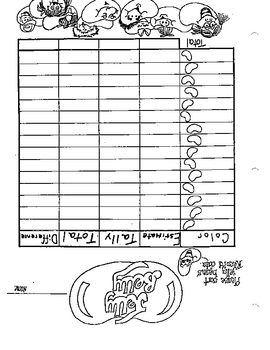
Jelly Belly Graph
You can give your students Jelly Belly Beans and then they can graph how many they have of each and then analyze the graph and answer questions about their findings.
Subjects:
Grades:
1st - 3rd
Types:
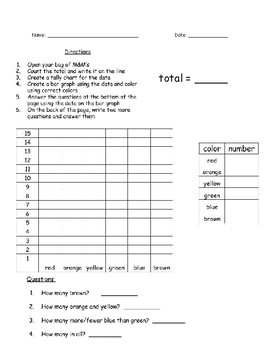
M&M Graphing Activity
Engaging activity for students to practice their graphing skills by collecting, recording, and analyzing data found in a fun size M&M bag!
Subjects:
Grades:
K - 2nd
Types:
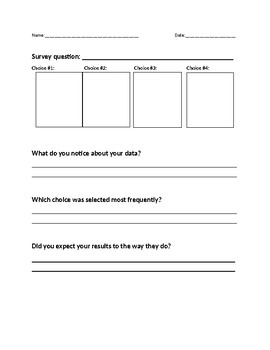
Survey Question and Graphing Project
This project is a great assessment tool to see if your student can create their own survey question, collect data, graph the data and answer questions about their result! It allows for student choice when determining the survey question and answer choices.
Subjects:
Grades:
2nd - 3rd
Types:
CCSS:
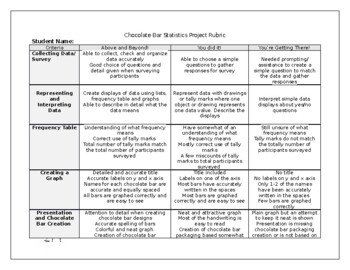
Chocolate Factory Statistics and Probability Project RUBRIC
An additional and more detailed rubric for the Chocolate Factory Statistics and Probability Project
Subjects:
Grades:
1st - 3rd
Types:
Using Data to Support a Hypothesis
In this math challenge, students must create a hypothesis and then collect and display data to support their hypothesis!
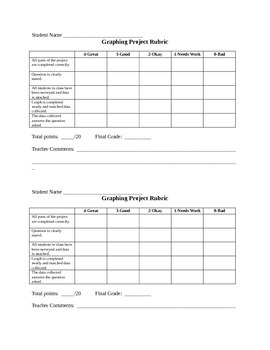
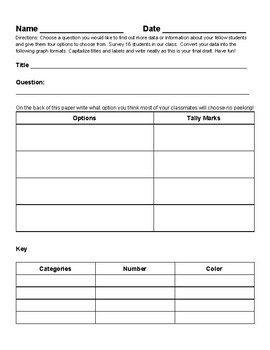
Survey Data Graph Project
Students will be able to survey fellow classmates using tally marks then turn their data into horizontal and vertical bar graphs, picture graph, line plot, and a pie chart (circle graph). I have used varied terminology on multiple charts as the vocabulary is different on various assessments.
Subjects:
Grades:
2nd - 4th
Types:
CCSS:
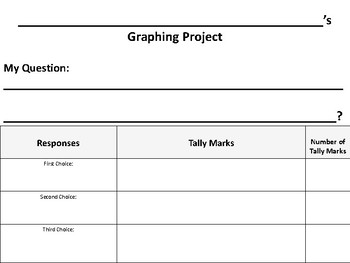
Graphing Project
Helpful to use for data collection, surveys, voting, statistics, and graphing math lessons.
Subjects:
Grades:
K - 3rd
Types:
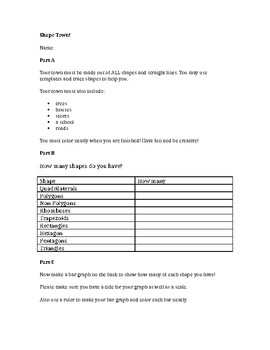
Shape Town
Students will be given a list of things to make a town out of. They will count how many shapes that they have in their town and write down their data. They will create a bar graph to keep track of their data.
Subjects:
Grades:
2nd - 3rd
Types:
Showing 1-17 of 17 results


