17 results
Not grade specific statistics projects
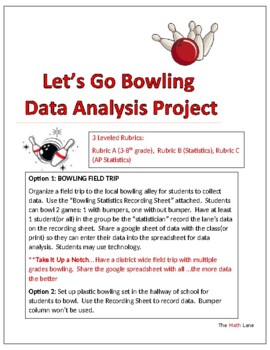
Let's Go Bowling Statistics STEM Project & Field Trip (3-12 and AP Stat)
Great END OF YEAR project. Get ready to strike up some fun with your students on a field trip to the bowling alley or right in your own hallway with a plastic bowling set! This isn't just any ordinary field trip - it's a real-world data collection extravaganza. 3 different leveled rubrics (Grade 4-10, Statistics, AP Statistics) so students can analyze the data based on their math knowledge. Students will be able to practice creating and analyzing graphical displays, scatterplots, construct c
Subjects:
Grades:
Not Grade Specific
Types:
Also included in: High School Statistics Project Bundle
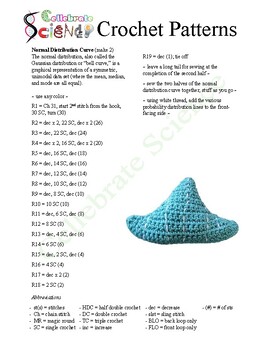
Standard Curve Crochet Pattern
Explore our crochet project showcasing a standard curve to offer students an interactive and captivating approach to learning about the standard distribution curve. Engage in a hands-on experience that will enhance understanding and retention of this important concept.
Subjects:
Grades:
Not Grade Specific
Types:
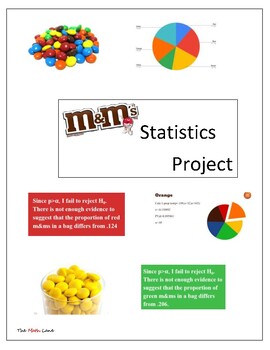
M&M Statistics 1 sample Proportion Hypothesis Test Project/Activity No Prep
Get ready to "yummify" your statistics class with this no prep project that will have your students conducting proportion hypothesis tests using everyone's favorite treat - M&Ms! Perfect for statistics or AP Statistics classes, this project offers two exciting options for implementation. For an engaging in-class activity, simply give each group a bag of M&Ms and watch as they compare proportions across groups or have students take a handful from a large bag to create their own sample. Th
Subjects:
Grades:
Not Grade Specific
Types:
CCSS:
Also included in: High School Statistics Project Bundle
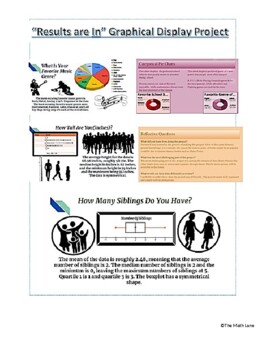
"The Results are In" Graphical Display Stats End of Year Project (All Grades)
Get ready to take your data analysis skills to the next level with our Graphical Display Project! Designed for students who want to create visually stunning displays of their data, this project allows you to not only collect data using Google Surveys, but also analyze and present it using Google Sheets. With detailed instructions, project examples, and a comprehensive rubric included, you'll have everything you need to create professional-looking graphical displays of both numerical and categori
Subjects:
Grades:
Not Grade Specific
Types:
CCSS:
Also included in: High School Math Projects (Algebra II and Statistics) STEM No prep
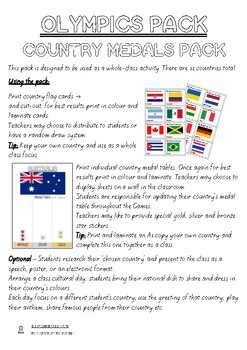
Olympics Country Medal Tables
Get your class excited about the Olympic Games this year with this fun resource!This pack is super simple and easy to use! I have used it with middle-primary classes for the past three Olympic Games. (Yes, that's right, you can use this again and again).A fantastic way to teach geography and statistics with a real life focus.Students can learn from each other as they become responsible for an individual country.Watch as your students become interested in another country in the world. You will he
Grades:
Not Grade Specific
Types:

Data Handling: Traffic Nightmare Tally and Bar Charts Project
A fantastic and very comprehensive resource including a Traffic Nightmare project book, lesson plan, student objective sheets, PowerPoint extended data collection exercise, PowerPoint Tally Chart Bingo, student bingo sheet and a PowerPoint introduction to using tally charts.
This project focuses on a scenario where the opening of a local supermarket has resulted in a great increase in heavy traffic through a residential area. The students tally the vehicles they see on screen to 'prove' the incr
Subjects:
Grades:
Not Grade Specific
Design Your Own Probability Experiment: Performance Task
This activity was designed to engage students in the math classroom by having them apply their knowledge of theoretical & experimental probability by designing their own probability experiment & analyzing one of their outcomes. This task works well after discussing the difference between theoretical & experimental probability, but could also be used to introduce this concept.
Subjects:
Grades:
Not Grade Specific
Types:
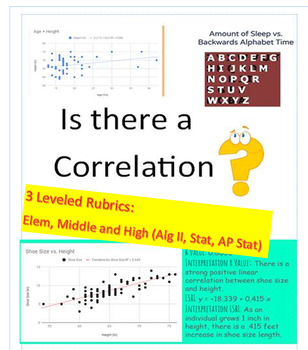
Correlation? Data Project (3 Rubrics_Elem/Middle School/ AP Stats) EOY
Get ready to supercharge your students' data analysis skills with this dynamic project! Perfect for end of year or semester project. In this engaging activity, students will have the exciting opportunity to collect their own data through surveys, online research, or real world data sets. They will then dive deep into the world of statistics as they determine if there is a correlation between two variables. With three different leveled rubrics, this project is perfect for students of all ages an
Subjects:
Grades:
Not Grade Specific
Types:
CCSS:
Also included in: High School Math Projects (Algebra II and Statistics) STEM No prep

Teaching with Baseball Statistics
I use this activity to teach my science students how to model an idea using data. Students learn to predict the outcomes of a baseball pitcher based on their last 3 years of stats. Students learn to analyze their data and determine trends in the data. Students also learn to compare data from their pitcher to other students' pitchers (collaboration). Students also must be able to/learn to accurately graph their data. There is also a research component as students must research their pitcher's
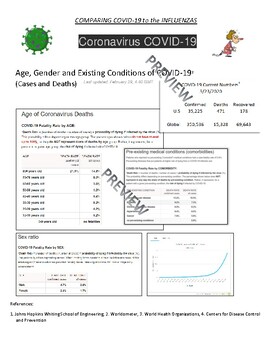
Coronavirus COVID-19 Compared to the Flu
COVID-19 Updated COVID-19 data to reflect as of March 23, 2020. Posted at the end of the solutions is the previous solutions from 3/6/20 so comparisons can be made. This worksheet provides data on the current COVID-19 viral outbreak and asks probability questions comparing the COVID-19 versus Influenza viruses. New material included discussion the CDC Mortality rate vs Crude Mortality rate. Worksheet offers hand on calculation and reasoning concerning the COVID-19 Pandemic. The student will n
Subjects:
Grades:
Not Grade Specific
Types:
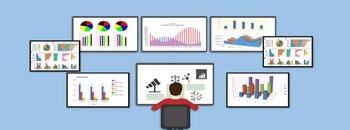
Mean Median Minimum Maximum Range Project
In this beginner statistics project, students will work with their peers to create real-life applications of data while at the same time learning about five key statistical concepts: mean, median, minimum, maximum and range.
Subjects:
Grades:
Not Grade Specific
Types:
Sector of a Circle Pie Chart Activity
Students will get to practice their skills in both finding areas of sectors and data graphing in this fun pie chart survey activity. Instructions are included for students and teacher on the handout. Students will be required to ask a question, record answers, plot the answers as sectors in a pie chart, and find the areas of the sectors.
Subjects:
Grades:
Not Grade Specific
Types:
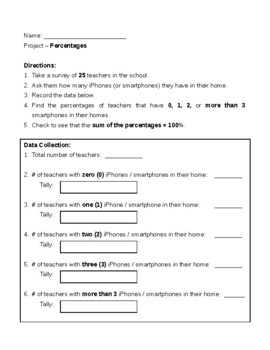
PROJECT - Percentages
Hi there. This is great project where students take a survey of 25 teachers in their school to see how many iPhones / smartphones there are in their homes. Students tally the results and express their results in fraction, decimal, and percent form.This year we took a "field trip" around the school during class to collect all of the data. The students loved it!
Subjects:
Grades:
Not Grade Specific
Types:
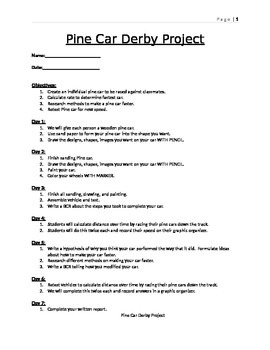
Pine Car Derby Project
The Pine Car Derby Project is a fantastic, 2 week lesson, we used when teaching 6th grade math. This lesson capitalizes on students kinesthetic and visual interests, using Pine Car, and teaching them about distance, speed average, hypothesis and the scientific method. Students build their cars, test them on the track, record data, modify their cars and retest. Students than answer short questions about the data collected and information learned. This lesson also contains a presentation in pr
Subjects:
Grades:
Not Grade Specific

Personal Finance Game: Stock Market Simulator, Stradr.com
Stradr.comFree paper trading platform with education settings that hide user interaction, local groups for classroom competition, and global currency for all users, regardless of location. Also includes aftermarket trading, fractional shares, and the ability to start an account with as little as a cent of simulated money. Account resets also offered.
Subjects:
Grades:
Not Grade Specific
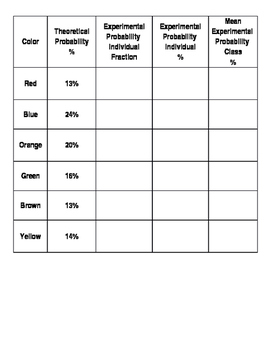
M&M Color Probability
This is the graphic organizer I used for an M&M Color activity where we compared Theoretical to Experimental probability of the colors in a Fun Sized bag of candy.
Subjects:
Grades:
Not Grade Specific
Types:
1:13
Patty Fernandez You Tube Channel Video Art Resources!
An entertaining stop motion / claymation video that lists the past 2 years of ART Lessons on myYou Tube Channel : Patty Fernandez ArtistVisit my You Tube Channel: Patty Fernandez Artist for over 1,000 videos that integrates the Visual Arts with other content areas you teach in a school day.Share my You Tube Channel: Patty Fernandez Artistwith your friends, school, and District.
Subjects:
Grades:
Not Grade Specific
Showing 1-17 of 17 results


