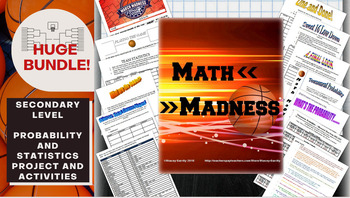
Math March Madness Full Tournament Project {BUNDLE}
- Word Document File
Description
Harness the excitement of NCAA March Madness with this huge project for secondary math teachers that follows all stages of the tournament! This Common Core aligned bundle comes with bonus parts not sold individually in my store so you can create a rich immersion in the tournament, practice probability and statistics and learn some interesting new ones along the way!
Save $3 plus get bonus content by bundling!
You can pick and choose which parts you would like to incorporate, or follow my schedule and do them all! The file is editable for your customization of local teams and content to cover.
INCLUDED IN THIS PACK:
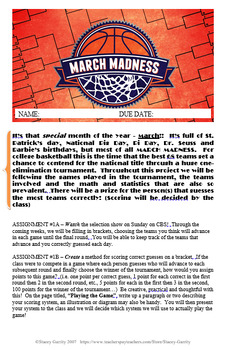
1) Cover page and introduction to the tournament, schedule of assignments - asks students to watch the Selection Sunday show as their first assignment!
2) Playing 'the Game' - students design a method for assigning points to score brackets (not to gamble of course, but for lively classroom competition!)
3) Team Statistics - Students research the teams in the tournament.
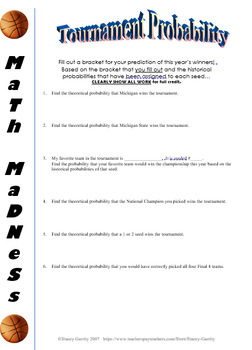
4) What are the Odds!? - Simple probabilities to get started.
5) Wins vs Total Games Played - Comparing win percentages of the teams and regions to determine if seeded fairly.
6) One and Done! - A look at the elimination of teams as an exponential model.
7) The Sweet 16 Low Down - A closer look at the remaining 16 teams and their offensive/defensive performance thus far, opportunity for research and analysis of statistics in the media.
8) What's the Probability - If all 64 teams were put into a hat, what's the probability... of various situations. Compound and/or probabilities.
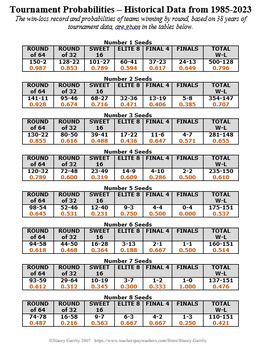
9) Historical Data Tournament Probabilities - 38 years of win/loss data by seed up to 2023. Will allow for authentic figuring of actual chance of the teams students picked making it to various rounds.
10) A Final Look - Measures of center and spread, making statistical graphs, box plot, data from all National Championship winners through 2023. Fun facts about the tournament. An optional page of least squares regression and residual calculation and plotting.
11) An option for a final reflection.
12) A full answer key. Though the tournament changes every year, sample responses are provided.
*Note: Not all pages are shown in the preview in the listing
I have done this project in Algebra 1, Algebra 2, Geometry, Precalculus, and AP Statistics. Depending on the level, I would pick and choose appropriate parts to include or remove. I would time the parts we would work on to align with the timing of the tournament. So on the week the Sweet 16 would be played, we would do the Sweet 16 Low Down. This can be ongoing for 3-4 weeks!
To introduce and hype up the activity I would start with playing videos of ESPN's Sport Science related to math in the tournament, then get students to watch the Selection Sunday Show. After Selection Sunday, I would play a couple clips of the regions which included our home state teams from the show for any students that missed it, and give students a copy of the year's bracket. I like a bracket that has the win-loss record printed next to the team names. This is nice for picking teams, as well as is helpful for a few parts of the project. I would make a copy of each student's bracket and hang it on the wall - this gets the competition heated up! After that it's up to you when to include the next part of the project! I also recommend projecting a live game while working on a part of the project when possible - an excuse to watch the games while academically on task! ;)
Enjoy!


