28 results
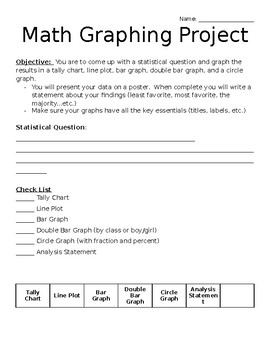
Free graphing rubrics
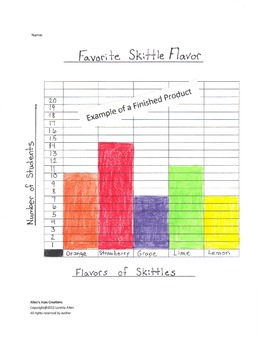
Bar Graphing - Skittles Candy
Students will taste test each Skittles Candy flavor, and then ask their classmates their favorite flavors and record the data collected. Then they use their data to create a bar graph. I use this in my 3rd grade class and it is always a big hit activity!
Subjects:
Grades:
2nd - 6th
Types:
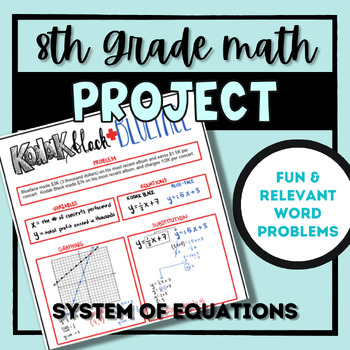
System Of Equations Project (With Relevant Student Problems)
This project incorporates relevant-to-student word situations and has students create, solve, and describe the equations, graphs, and tables of the two equations, as well as the solution to the system. It includes student handouts, an answer key, and rubrics for students, as well as a student-exemplar for them to refer to. It also includes an editable link to quickly change the names and make it more relevant to your students!
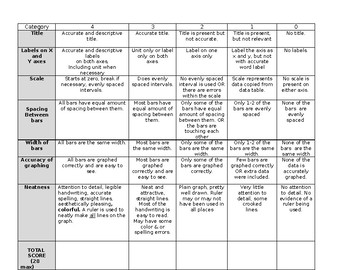
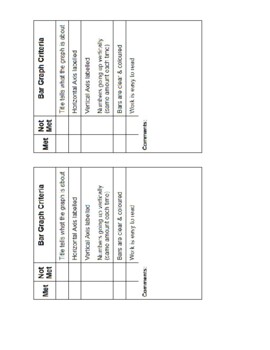
Bar Graph Rubric
Rubric to easily grade bar graphs made by students. Has a 4 point scale for each of these categories: Title, Labels, Scale, Spacing between bars, Width of bars, Accuracy of graphing, Neatness. Top total score on the rubric is 28 points.
I print 2 rubrics on one page and have a smaller version to staple to the students work.
I always include the word version for easy editing! We all teach a little differently!
Grades:
5th - 8th
Types:
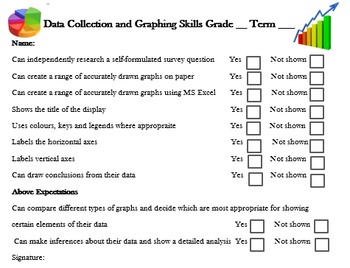
Graph and Data Assessment Checklist & Rubric
Short and quick-to-mark assessment rubric and checklist for graphing tasks suitable for students from grades 2 to 6.
You may also like:
-Comprehensive Multiplication Unit for free
- All Materials Maths units, just click on my store logo to view the full range.
Full set of Maths Assessments:
- Place Value Assessment
- Addition Assessment
- Subtraction Assessment
- Multiplication Assessment
- Division Assessment
- Fractions/Decimals Assessment
Subjects:
Grades:
2nd - 6th
Types:
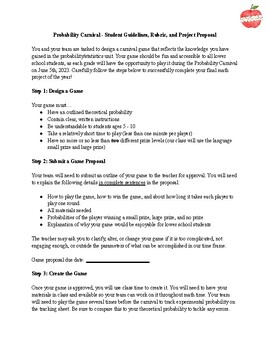
Probability Carnival Freebie
Students will dive into the core skills of probability by designing, creating, proposing, and reflecting upon a carnival game (a bloom's taxonomy dream)! Use and adapt this resource to fit the needs of your classroom to create a memorable learning experience. *Highlights: probability, statistics, graphing, project based learning, game design, teamwork, student-centered learningOptional inquiry-based learning essential question: How can we, as mathematicians, design and create an age appropriate
Subjects:
Grades:
3rd - 8th
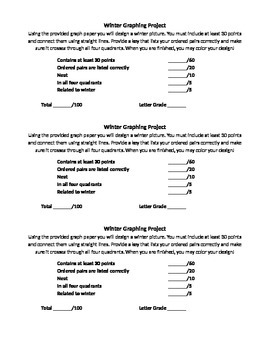
Winter Coordinate Graphing Project
This is a great project leading up to winter break for grades 3-6. It requires students to plot points in order to create their own winter themed image on a coordinate plane. Then students swap with a partner to graph their design!
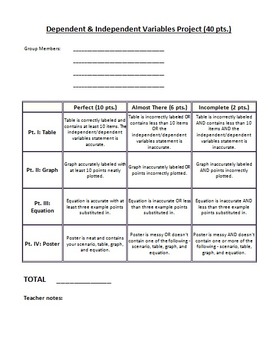
Independent & Dependent Variables Project
An independent & dependent variables project that includes making tables, graphs, and writing equations.
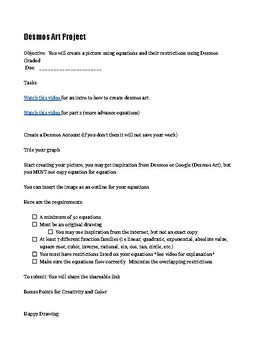
Desmos Art Project
A great End of Semester or Year project for Honors Math 3 students to put in to practice transformation of Parent Functions. Students have the option of creating from scratch an image, or using a clipart from their google search and adding it into Desmos. It also allows for discovery of other functions or non functions that are not specifically addressed in Math 3. Thank you for your support and I can't wait to see what you create!
Subjects:
Grades:
10th - 12th
Types:
CCSS:
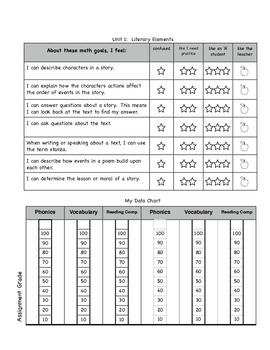
Common Core I Can Data Charts for 3rd Grade Reading
This is a data chart created to accompany the Reading Street Series. It combines the Common Core 'I Can Statements' and a coresponding graph for students to both rate their level of understanding and graph their test or assignment scores. The 'I Can Statements' are specific to what is being covered in the Reading Street series. The graphs change so that students practice using different types of graphs. I use these data charts as a tool to increase student ownership of their learning.
Grades:
3rd
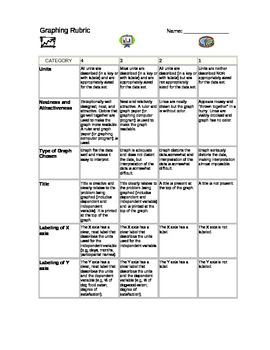
Graphing rubric
This is a rubric that we use to assess a student's ability to create an accurate graph.
Subjects:
Grades:
3rd - 5th
Types:
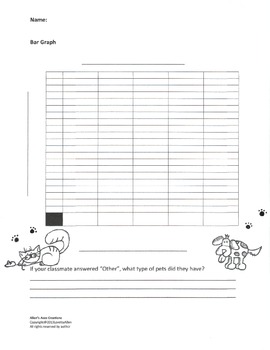
Graphing Classmate's Pets
This activity is hands on fun math!!! The students get to mingle with their classmates as they collect data on who has pets and what kind. Students love learning about each other.
After the students have surveyed their classmates, they use the data to create a bar graph of their classmate's pets. What better way to learn about bar graphs, than creating your own!!
Great "Ice Breaker" activity for the first week of school!
I have kept the pintables simple, so they do not use up all your print
Grades:
2nd - 6th
Types:
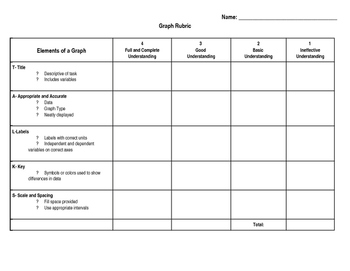
Graph Rubric
A quick rubric to check your students' work. There are five categories to check for on their graph. This can also be used for peer review.
Subjects:
Grades:
3rd - 9th
Types:
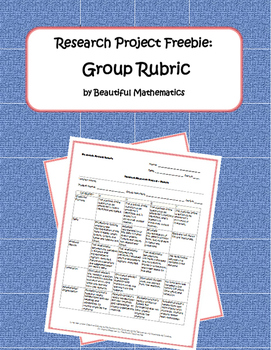
Research Poster Project Freebie
This research project rubric is part of a larger lesson plan for creating research poster projects. Check it out here: Algebra Research Project: Interpreting Functions.Please follow me to hear about new discounts, freebies and product launches. Visit my Beautiful Mathematics Store for more engaging math lessons. Provide feedback and get TPT credit on future purchases: Go to your My Purchases page. Click on the Provide Feedback button beside each purchase. You will be taken to a page where you
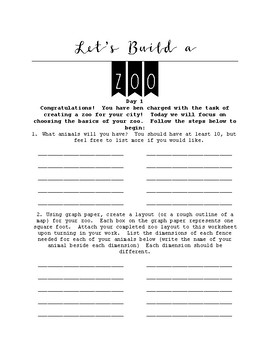
Let's Build a Zoo
This is a preplanned three day project designed for 8th grade students focusing on the CCSS's 8.F.B.4 and 8.F.B.5 along with mathematical practices 4 and 5. Each of the steps for each day are clearly outlined in these student worksheets and there are rubrics for each day and a final rubric for the entire project.
5th Grade Math - Graph Project
Students will be using cross curricular data (Science, Social Studied, and Math based data to generate their own graphs. The graphs required for the assignment include: stem and leaf, dot plot, and bar graph. A rubric is included.
Subjects:
Grades:
5th

Desmos Project Rubric - Parent Function Transformations
This is the rubric I use for my absolute favorite project in Algebra 2. After learning about the basic rules of transformations, students log into Desmos and use the Desmos Graphing Calculator to create an artwork that meets the requirements listed on this rubric. I treat this as a summative project because it covers so many skills and concepts.
Subjects:
Grades:
9th - 12th
Types:
CCSS:
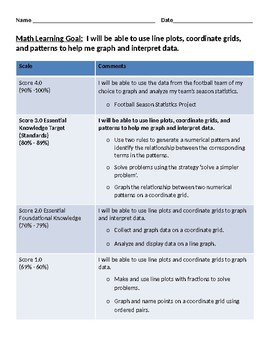
Fifth Grade Math Goal and Scale for Student Self-Tracking: Data and Patterns
Student Form for self-tracking progress through scale to meet the goal for Representing and Interpreting Data and Analyzing Patterns and Relationships (5.MD.B.2, 5.OA.B.3). Exit Tickets are a great way to evaluate your students' progress. By providing a tool for your students to record their level, from the feedback you provide on Exit Tickets, and track their progress toward meeting the goal, you will give your students the self-monitoring skills needed for success. This is also a great reso
Grades:
5th
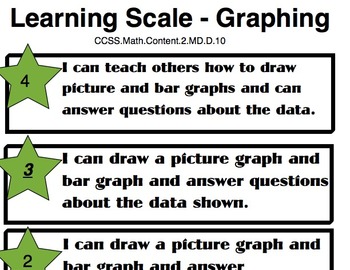
Learning Scale for Graphing
0-4 Learning Scale for graphing with 3 being the targeted proficiency level according to Common Core standards.
Subjects:
Grades:
1st - 3rd
Types:
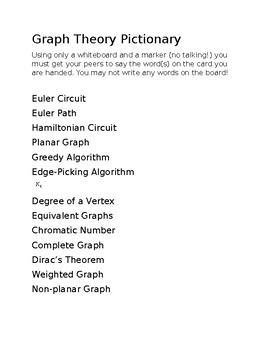
Desmos Project Rubric - Parent Function Transformations
This is the rubric I use for the Desmos Artwork Project I do every year in Algebra 2. Students are required to include a variety of parent functions and transformations in their original artwork design on Desmos. I treat this as a summative grade.
Subjects:
Grades:
9th - 12th
Types:
CCSS:

Scientific Process- Best way to store popcorn
Simple science experiment using the scientific method to set up an experiment and to collect data. It has pages to fill in responses to teach students the scientific method. Students will learn from this experiment on how to set up their future experiments and how to use the scientific method to record their data.
It can be viewed as a mini lesson for learning how to use the scientific method for science projects. This will take 3-5 class sessions, depending on whether this is their first lesso
Subjects:
Grades:
5th - 7th
Types:
CCSS:
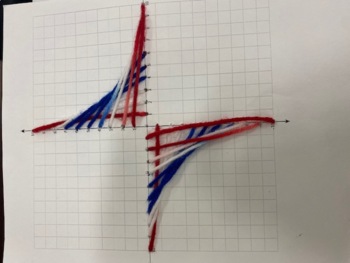
Standard Form Yarn Art Project
This project will demonstrate student understanding of Standard Form and plotting the x and y intercepts. Disclaimer- this project does not allow the students to graph the ENTIRE linear equation, just the x and y intercepts and connecting those two points.
Grades:
7th - 9th
CCSS:
Here's the Sketch
This activity is designed for 8th graders to individually construct various situations in which they can create qualitative graphs. Students will be paired with a partner so they can share verbal descriptions and graphs in order for the partner to correctly match each situation.
Showing 1-24 of 28 results


