109 results
Graphing rubrics under $5
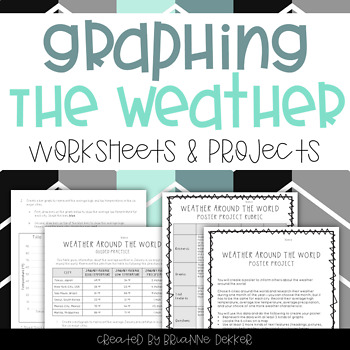
Graphing the Weather - Worksheets and Projects
This product contains science and math graphing worksheets and projects for a unit on weather. These resources were created with NGSS content and evidence statements in mind.
The first set of worksheets focus on weather around the world, and the second set focus on weather patterns in one area. Each set contains guided practice, in which students are given data and asked to create different types of graphs to represent the data; independent practice, in which students must gather data and then
Subjects:
Grades:
3rd - 5th
Types:
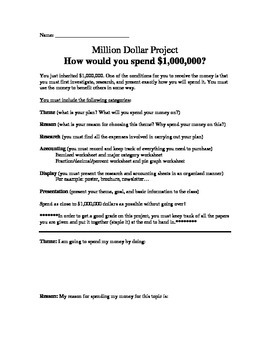
Million Dollar Project (Graphing, decimals, fractions, accounting and percents)
What would you do with a million dollars? How would you spend it?
In this project you've been left a 1 million dollar inheritance. The catch is you must first research and present how you will spend the money.
In the first part of the experiment, the students will fill out an accounting chart, where they will fill out an itemized chart displaying each item they plan on purchasing to complete their million dollar project. They will than be asked to put all those items into major categorie

Fluency Graphs (Monster Readers Theme)
Monster Readers Fluency Graphs--
Monitor your monster readers' fluency progress!
Great for record-keeping and data management!
In this packet, you will find:
* About Fluency & Tracking Progress (basic facts)
* Background Info on Timed Reading, Target Charts & Recording Sheets
* 5 Different Graphs: 60, 100, 120, 150 plus blank one to write in goal targets
* A class profile sheet
* Fluency Rubric
* Fun partner recording sheets
* 2 Award Sheets for meeting goals (one color, one b/w--half
Subjects:
Grades:
K - 4th
Types:
Also included in: Reading and Writing Super Mega Bundle Deal
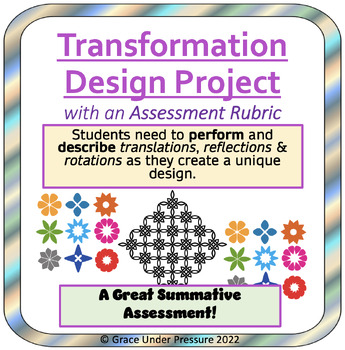
Transformation Geometry Project with an Assessment Rubric: Gr 6-8 Geometry
This creative and fun math geometry project assesses students’ ability to perform and describe 3 kinds of transformations: translations, rotations, and reflections. It is a great summative assessment for your transformation unit!It will take several work periods for students to create their design and write or type a detailed explanation of the process. This is how I can really see if they understand the concepts. I encourage students to describe their process using specific mathematical vocabul
Subjects:
Grades:
6th - 8th
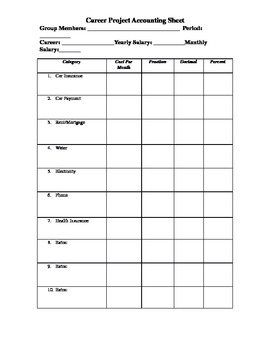
Career Monthly Bils Circle Graph Project
In this project students draw a career and select 10 of their monthly bills. They then figure what percent of their monthly salary goes to each item and create a circle graph showing where their money goes. The file you will receive includes a rubric for the project, an accountability sheet, 24 "career cards", a list of choices for the 7 required and 3 choice items in the project, and teachers notes about how the project has been made successful in their class. It is a word document so any of th
Subjects:
Grades:
6th - 8th
Types:
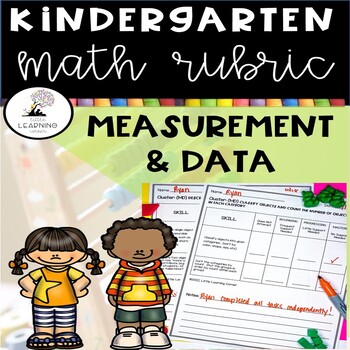
Kindergarten Math Rubric MEASUREMENT AND DATA | Assessments
A kindergarten rubric or assessment tool for the Common Core domain, Measurement and Data. Document students skill ability ranging from No Effort to Mastered: No Support Needed.CONTENTS1 rubric for the cluster- Describe and compare measurable attributes1 rubric for the cluster- Classify or sort objects and tell how many objects are in each category.Great tool to record students progress. Use during observation in centers, activities, or after completing formal assessments. Copy and share with
Subjects:
Grades:
K, Staff
Types:
Also included in: Kindergarten Math Rubrics Bundle | Assessments Data Collection
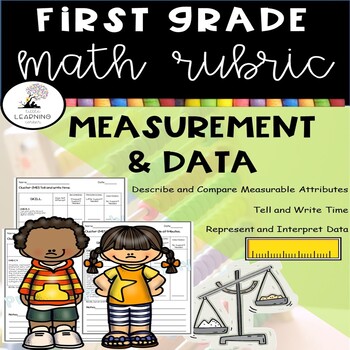
First Grade Math Rubric | Measurement and Data Assessments
First grade rubric or assessment tool for the Common Core Math Standards. This rubric is for the Measurement and Data domain.The skills include:Measure lengths indirectly and by iterating length units.Tell and write timeRepresent and interpret dataCONTENTS1 Rubric for Measure lengths indirectly and by iterating length units.1 Rubric for Tell and write time1 Rubric for Represent and interpret dataGreat tool to record students progress, add to progress reports or report cards. Use during observat
Subjects:
Grades:
1st
Types:
Also included in: First Grade Math Rubrics Bundle | Assessments Data Collection
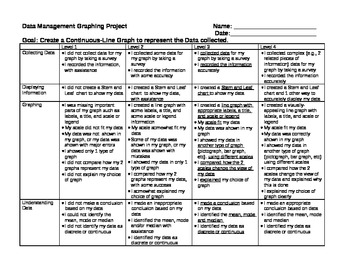
Grade 6 Graphing Project Rubric - Ontario
This is a rubric for a graphing project based on the Grade 6 Ontario Curriculum. It covers all points from the Grade 6 Data Management related to graphing (not probability), EXCEPT - determining how well the data represents a bigger population.
Download the preview to see a sample that one of my students made.
The project I did with my class was:
-collect data by doing a sample, research or experiment
-create a tally chart, stem and leaf plot, and t-chart showing the data
-create a continuou
Grades:
6th
Types:
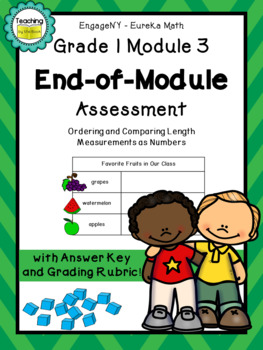
Eureka Math First Grade Module 3 End-of-Module Assessment
This product aligns with EngageNY - Eureka Math Grade 1 Module 3. It is a comprehensive assessment of the module on Measurement, Data, and Graphing. Students will be evaluated on these standards by organizing a given set of data and answering questions based off of that data. Students will also be assessed on measurement skills by using centimeter cubes to measure pictures and answer questions based off of those measurements. This product includes: Pages 1 & 2 - Cover & Teacher NotesPag
Subjects:
Grades:
1st
Types:
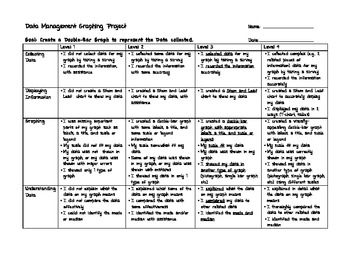
Grade 4 Graphing Project Rubric - Ontario
This is a rubric I created based on the Grade 4 Ontario Curriculum. It includes all specific expectations for Data Management related to graphing (not probability).
The preview is a sample that one student created. He left the bottom blank to print out a picture of LeBron!
I used this to assess a final data management project my class did. Each student had a bristol board and had to:
-collect data through a survey or experiment
-show their data in a tally chart, stem and leaf plot and t-ch
Grades:
4th
Types:
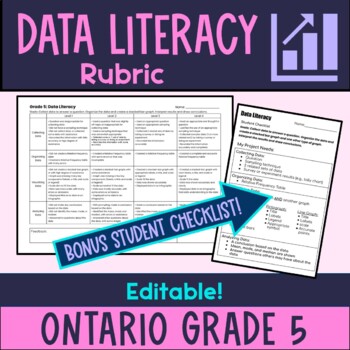
Grade 5 Data Literacy: Graphing Rubric - Ontario
This is a rubric and student checklist for a Grade 5 graphing unit project, based on the 2020 Ontario Math Curriculum for Data Literacy. Save time with this ready-made rubric to make your grading easier. It's also editable in Google Docs, so you can change it to suit your needs and focus. Includes expectations for:collecting dataorganizing data visualizing dataanalyzing data.This rubric will save you time as you grade your students learning throughout your data literacy unit on graphing. Student
Grades:
5th
Types:
Collecting, Organizing and Interpreting Data Assignment -Data Management Digital
In this culminating task, students will create a survey question, organize their data using frequency tables, graph their data and interpret their results. They will also find the mean, median, mode and range of the data.This is assignment asks students to create a presentation that will include the following:A survey questionMean, Median, Mode and Range of the dataFrequency table for the data3 different visual representations of their findingsInterpretation of the resultsThis product includes
Grades:
4th - 8th
Types:
Mathematics in Nature {CCSS Math and NGSS Aligned}
Students explore and apply the principles of mathematical patterns in nature in a fun and engaging way! First, students identify and describe patterns in the natural world before heading outside to find patterns on their own. Next, students begin to explore number patterns in nature using the Fibonacci sequence. Fin fingerprint activity keeps students interested and engaged! Next, explore cycles in nature by creating a model on paper using 3-dimensional objects. Rubric included. Students are
Grades:
4th - 7th
Types:
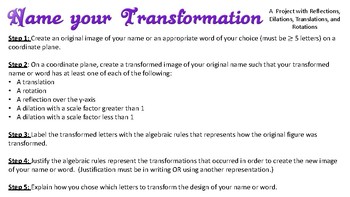
Transformations Project - Translations, Rotations, Reflections, and Dilations
This short project called "Name your Transformation" is designed to give students the opportunity to create a graphical image of their name or word of their choice and then transform it in a way that creates a fun design of their name or word. Steps and criteria are provided for students to transform the figures or letters of their name/word and justify their work. Graph paper is provided for their original image but students are encourage to complete their transformed image on a larger grid pap
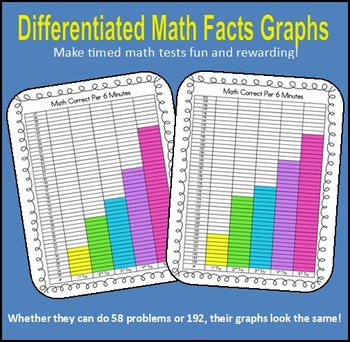
Differentiated Math Facts Graphs
These "Differentiated Math Facts Graphs" allow the kids to graph the scores of their timed math facts tests. The visual encourages students to work towards beating their own scores.
I've found that my students do not compare graphs based on the tiny numbers to the side, but rather by whose bar is tallest or who made the most growth. This allows even the struggling students to be recognized and feel great for their hard work!
Can be used with addition, subtraction, multiplication, or divisi
Subjects:
Grades:
1st - 4th
Types:
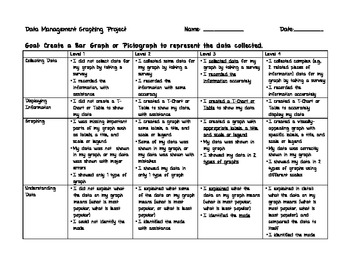
Grade 3 Graphing Project Rubric - Ontario
This is marking rubric for a Grade 3 Graphing project - based on Ontario curriculum. It would be for a final project. I have also included a student checklist - for students to use as they create their work to ensure they are meeting the expectations. The preview shows a project one student created, at the Grade 5 level. He left the bottom empty to print out a picture of LeBron.The project I did:Students created a survey question and collected data from their classmates.Students recorded the inf
Grades:
3rd
Types:
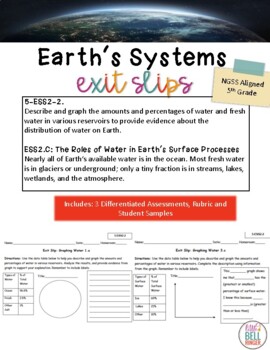
NGGS Earth's Systems Exit Slips
NGSS Earth's Systems Exit Slips--Save tons of time by downloading my crafted assessments, which integrate math and writing standards into your curriculum. As you cover topics such as the hydrosphere and water cycle, choose one of my differentiated exit slips to assess your diverse learners. **Rubric Included About NGSS: Next Generation Science Standards, developed by 26 state partnerships in 2013, have already been adopted by 12 states (including Illinois, California, Delaware, New Jersey, etc)
Grades:
5th
Types:
NGSS:
5-ESS2-2
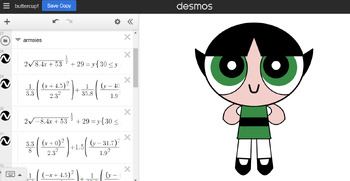
Algebra 2 Final Project: "Graphical Creativity: Transforming Functions w/ Desmos
Engage your Algebra 2 students in a creative exploration of functions with this captivating final project. In "Graphical Creativity," students utilize their knowledge of various function types and transformations to design an original image using the Desmos graphing calculator. From rational and exponential functions to sine and cosine curves, students will unleash their creativity while mastering key mathematical concepts.This project guides students through each step of the process, from brain
Subjects:
Grades:
9th - 12th
Types:
CCSS:
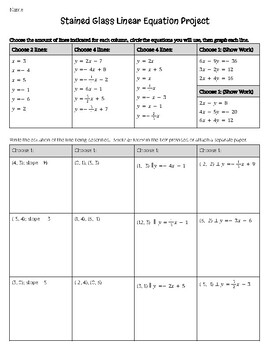
Stained Glass Linear Equations Project
This project allows students to show their knowledge of graphing linear equations as well as writing linear equations. Equations and problems are provided for students to choose from so that each student can make their own original stained glass window by graphing 15 linear equations.Students are provided with lists of linear equations to choose from to graph. Equations include: horizontal and vertical lines, equations in slope-intercept form (positive, negative, fractional, and whole number s
Grades:
8th - 9th
Types:
CCSS:
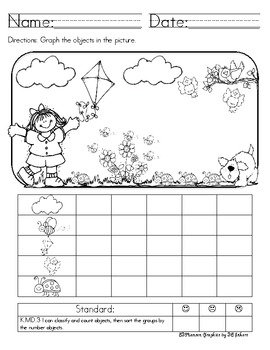
Graphing & Sorting (Common Core)
Here are four worksheets/assessments on sorting and graphing using the Common Core.
STANDARD:
K.MD.3 Classify objects into given categories; count the numbers of objects in each category and sort the categories by count. (Limit category counts to be less than or equal to 10.)
Made using DJ Inkers clip art & fonts. © www.djinkers.com.
My DJ Inkers license number is 0113179860.
Grades:
PreK - 1st
Types:
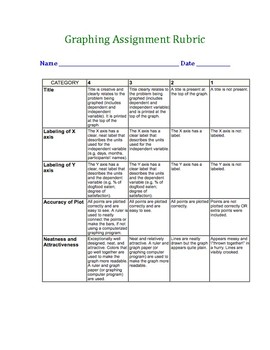
Graphing Rubric for Student Graphs
see preview.....check preview!100 WORD SEARCHES HERE!!!!!THIS RESPONSE JOURNAL MIGHT BE HELPFUL, TOO!POSTERS FOR YOUR CLASSROOM!GREAT RUBRIC BUNDLE!MY BEST PRODUCT-BUSINESS CLASS!GOOD CHARACTER WORD SEARCH!GROUP WORK SELF-EVALUATION!SOCIAL STUDIES BUNDLE…Lots of presentation rubrics!
Subjects:
Grades:
7th - 12th
Types:
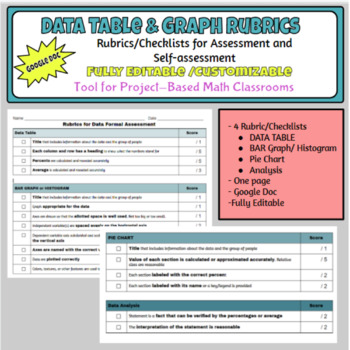
Data Table & Graph Assessment Rubrics/Checklists
4 Assessment Checklists/Rubrics for the following math and science skills: Making Data TablesMaking Bar Graphs/ HistogramsMaking Pie Charts/Circle Graphs (This is a WORKSHEET on HOW TO MAKE PIE CHARTS)Making Analysis Statements from DataFully editable Google Doc
Grades:
6th - 12th
Types:
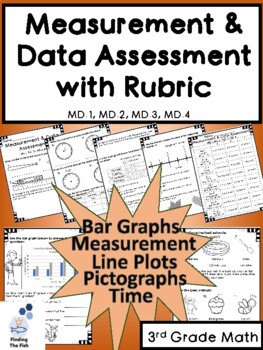
3rd Grade MD Assessment with Rubric: Graphs, Time, Measurement, Volume, Mass
Students will show what they know about time, elapsed time, measurement in inches, volume, mass, bar graphs, pictographs, and line plots. Each bar graph, pictograph, and line plot has questions for students to interpret the data on the graph. Students will use the ruler to measure items to the nearest quarter inch. Students will looks at clocks and tell the time, then use given times to figure out the elapsed time. They will also use their best judgement on mass and volume measurements. This as
Subjects:
Grades:
3rd
Types:
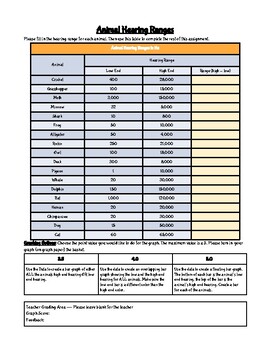
Graphing Animal Hearing Ranges (Scaffolded graphing)
This worksheet has students look at a variety of animal hearing ranges and then graph (leveled options) the hearing ranges and answer questions using the data.
Grades:
6th - 10th
CCSS:
NGSS:
MS-LS1-3
, MS-LS1-4
, MS-LS1-8
Showing 1-24 of 109 results


