299 results
Free statistics lessons
Mean, Median, Mode, and Range Lesson Plans, Task Cards, and Activities
This product contains 5 days worth of activities and worksheets, pre-test, and post test, answer keys, task cards, and a clever activity to help students distinguish between these different types of averages that I guarantee you have never seen before.
This item has beed revised as of 2/21/2014. I have added "I have...Who has?" that includes 20 cards that is intended to review mean, median, mode, and range plus other terms. Enjoy!
Subjects:
Grades:
3rd - 6th
Types:
Statistics:Scatter Plots and Lines of Best Fit MYSTERY ACTIVITY
In this fun activity students will solve the mystery of the stolen art by collecting data on classmate's standing long jump and height. Students will create a scatter plot and line of best fit for their data; then use their data to make predictions for the 5 suspects. Students will create a one page investigate report to discuss their procedure of investigation, their conclusion, and the strength of their conclusion by interpreting the correlation coefficient. Skills Used:Measure using RulersCon
Subjects:
Grades:
8th - 11th
Types:
CCSS:
Also included in: Common Core Algebra 1: STATISTICS UNIT - BUNDLE PRICE!
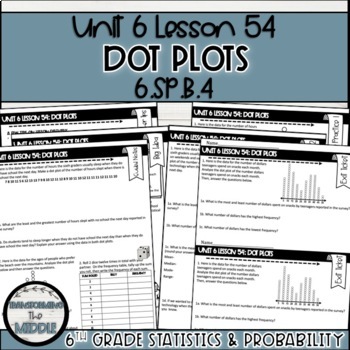
Freebie Dot Plots Lesson | 6th Grade Math
This Dot PLots lesson is a free, fully aligned lesson for 6th grade Math Common Core standards 6.SP.B.4 and 6.SP.B.5. In this lesson, students will learn how to read a data set to create a dot plot. Students will learn how to display the data, analyze it, and make observations about the data set. About This Product:-PDF printable-14 page printable lesson includes:1 teacher overview/product page1 lesson notes page that explains the standards and flow of the lesson1 teacher tips page that explains
Subjects:
Grades:
6th
Types:
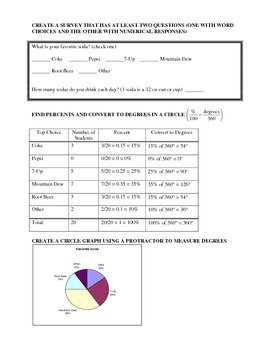
Construct a Survey Lesson/Project Plan
This PDF document consists of three parts: a lesson plan, project instructions, and a grading rubric. The lesson has students construct a survey that will have at least two questions: one that is multiple choice and one that has a numerical answer. It can either be an individual assignment or a group assignment and takes 2-3 days. I used this towards the end of the year as a review exercise since it covers multiple concepts: percents, circle graphs, central tendency (with outliers), box-and-whis
Subjects:
Grades:
6th - 9th
Types:
Mario's Dilemma {Mean, Median, Mode, and Range Activity}
This real-world mean, median, mode, and range activity is perfect for use in grades 6-7. Students are asked what would happen to each measure when a student earns a low test score, then describes the changes for each measure. Students are also asked to calculate and describe the change in a grade when a student studies for a test and when they do not. They are able to see how each measure is affected.
Enjoy :)
Kendra Passarelli
Visit my blog at: This Little Ladybug
ThisLittleLadybug@gmail.co
Subjects:
Grades:
6th - 7th
Types:
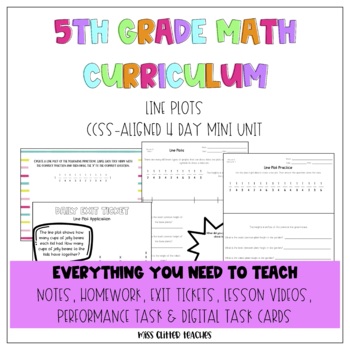
5th Grade Line Plot Mini Unit #distancelearning
Looking for a grab, print and go unit for the 5th grade data standards? Look no further! This unit has everything you need to teach 4-5 days. Everything from fill in the blank notes, video notes, daily homework, exit tickets, digital task cards, performance task and organization pieces.Fill in the blank notes are perfect for 5th graders to start learning to take notes. Bite size information with a few examples to show how to work with decimal operations. These one sided notes can be printed at 8
Subjects:
Grades:
5th
CCSS:
Also included in: Worksheet for Grade 5 Maths
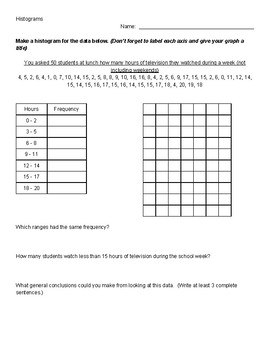
Histograms
Students will practice making histograms and manipulating bin width to see the change in frequency.
Subjects:
Grades:
6th - 9th
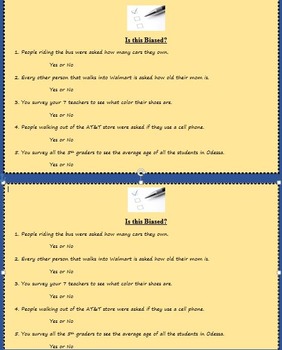
Is this Biased? (populations and random samples)
This is a 5 question quiz, exit ticket, do now, or homework assignment that reviews how surveys and samples can be biased sometimes. All 5 can be answered with a yes or no for whether it is indeed a biased survey. Enjoy and please rate and/or comment on this product!
Subjects:
Grades:
5th - 9th
Types:
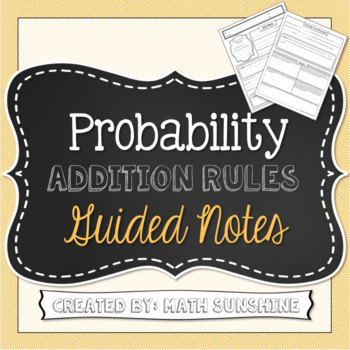
Probability Addition Rules Guided Notes (Mutually Exclusive and Overlapping)
Probability Addition Rules Guided Notes
This set of guided notes focuses on finding the probability mutually exclusive and overlapping events. All of the problems feature the key word "OR." For example, students might have to find the probability of choosing an ace or a spade from a standard deck of cards.
These fill in the blank notes include 3 examples and 5 practice problems. I have included the full size notes as well as the notes printed 2 to a page, which fits well in a spiral notebook
Subjects:
Grades:
6th - 12th
CCSS:
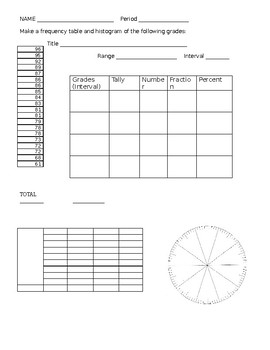
Intro to Frequency Tables - Histogram
This is a student friendly worksheets for students to learn how to collect data and make a frequency table and Histogram and circle graph. First page, set of grades are used as data, then students can fill in the frequency table.
Subjects:
Grades:
5th - 7th
Types:
Data Analysis Activity - Mean, Median, Mode and Range
An engaging student-led activity whereby the students will collect the measurements of other student's hand spans and then analyze this data.
Student will find mean, median, mode and range and then graph the data using a bar graph, histogram, line graph, etc.
If you download this activity, please rate it and leave comments. Thank you! :)
Subjects:
Grades:
7th - 9th
Types:
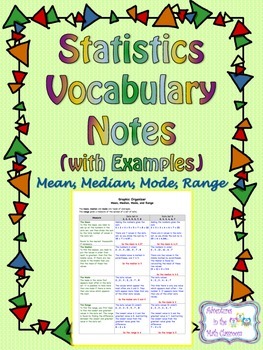
Statistics Vocabulary Notes - Mean, Median, Mode, Range
These color-coded vocabulary notes help students find the mean, median, mode, and range of a data set through example. There are two sets of data that are used to show students the different possible outcomes when it comes to finding the mean, median, mode, and range of a data set.
Subjects:
Grades:
4th - 9th
Types:
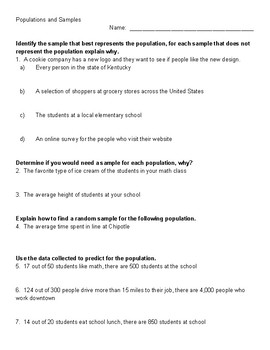
Populations and Samples
Students will practice identifying populations and samples, and determining if a sample is random.
Subjects:
Grades:
6th - 8th
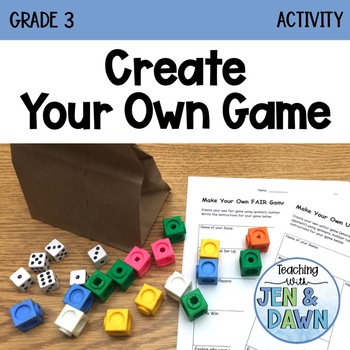
FREE Probability - Create Your Own Game (Grade 3 Activity)
In this fun probability activity, students apply their knowledge of frequency of outcome and fairness in a game by creating their own fair and unfair games. A fully editable Word version of student handouts is included! *****This activity is available as part of our complete unit on Probability – check it out!***** Teaching with Jen and Dawn lesson and unit plans meet the Ontario curriculum expectations.
Subjects:
Grades:
3rd
Types:
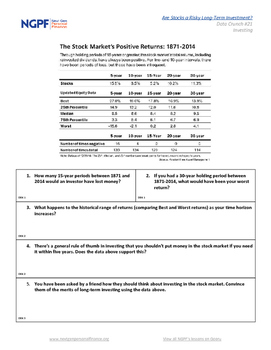
Are Stocks A Risky Long Term Investment?
Using research from WisdomTree Asset Management, students analyze the returns in from the stock market over the long term. NGPF Data Crunches ( cli.re/ngpf-data-crunch ) teach your students key personal finance concepts while also honing their analytical skills.
Grades:
7th - 12th
Types:
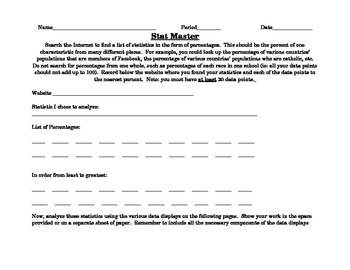
Stat Master- Statistics Analysis and Data Displays
This web-based performance task allows students to find statistics on the internet and the analyze and display the statistics using various displays. Finally, students are prompted to write about their analysis, explaining when specific displays are used and justifying their choice of a given display.
The data analysis and displays included are:
-Measures of Central Tendency (mean, median, mode)
-Measures of Variation (extremes, quartiles, or five-point summary)
-Box-and-Whisker Plot (or Box p
Subjects:
Grades:
5th - 9th
Types:
I Do Solemnly Swear...(Statistics Project)
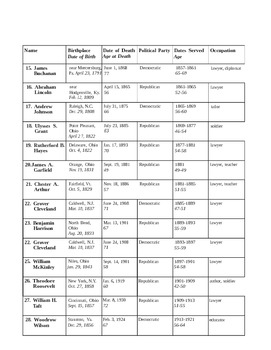
This is a statistics project that can be modified to fit grades 6 to 12. This can also be done by hand or in excel. It would be a great assignment to use as a unit project or as a group presentation. It is a cross curriculum activity that will combine history and math together to give the kids a great way to explore box and whisker plots, bar graphs, pie charts, and more. Because this is statistics, you can change the way the graphs are created to fit the need of the course you are teaching!
Subjects:
Grades:
6th - 12th
Graphs and Statistics
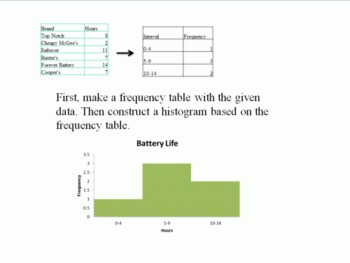
These five lessons cover the basics about describing sets of data. Topics covered are mean, median, mode and range. There is also information about bar graphs, histograms, line graphs, and circle graphs, as well as line plots and frequency tables. There is also a lesson about misleading graphs and statistics, providing a great opportunity to teach CCSS.Math.Practice.MP3 (Construct viable arguments and critique the reasoning of others.)
This work is licensed under a Creative Commons Attribution-
Subjects:
Grades:
5th - 7th
Intro to Probability, Mean, Median, Mode, and Range
In an effort to make high quality educational material more accessible to parents and teachers alike, regardless of location and/or socioeconomic status, I have decided to post lessons I create on here for FREE. The products I make consist mostly of Google Slides in PDF format for K-8th grade students. They cover a wide range of subject matter, but focus mainly on math and language development. Each lesson is created with the intention of keeping students attentive and actively engaged by using
Subjects:
Grades:
2nd - 4th
INTERACTIVE: Invest With Stax (Stock Market Arcade Game)
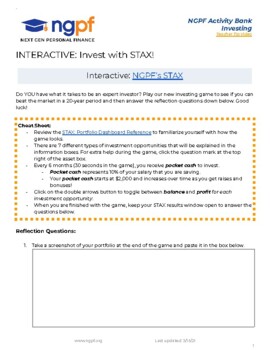
In this activity, students will:Make over 40 investment decisions as they allocate their savings between a multitude of investment optionsReceive short in-game lessons explaining the details of the specific investmentPractice diversifying their portfolio to yield the highest return
Subjects:
Grades:
7th - 12th
Types:
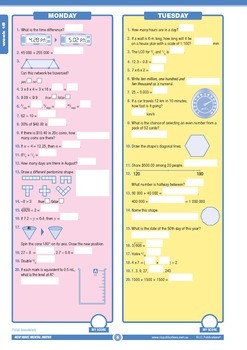
Mental Maths Workbook Year 7 - Australian Curriculum Aligned
Provide your students with daily practice and watch their mental recall, maths knowledge and understanding, and problem-solving skills improve. Day-by-day activities cover all mathematics strands and are developmental throughout each book and the series. Supported by a weekly testing program (levels D-G), New Wave Mental Maths is the complete mental mathematics resource.
Free Trial Booklet Download. Follow this link to view the full book: New wave mental maths workbooks
Subjects:
Grades:
6th - 8th
Types:

Box and Whisker Plots
An introduction to Box and Whisker Plots using data from everyday scenarios such as yearly average sunnny days on the beach, shelter dog adoptions, and miles driven to favorite restaurants. Includes learning goals, vocabulary, teacher directions, student work space worksheets, keys. Found at "It's All About the Kids"
Subjects:
Grades:
5th - 7th
Types:
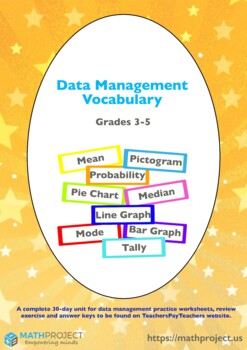
Data Analysis and Probability Vocabulary (Grade 3 to 6)
Data Analysis & Probability for Grade 3 to 6 / Introduction to Statistics : Definitions of Mean, Mode, Median, Pie Chart, Line Graph, Bar Graph, Tally Chart, Pictogram, Stem and Leaf Plot and Probability
Subjects:
Grades:
3rd - 8th

Creating Histograms, Box Plots, & Dot Plots - Lesson Plan with Activities!
*** This file is FREE because educators never get paid enough. If you find this file helpful, please consider donating no more than $1.00 via Zelle or PayPal (as Friend/Family) to InfiniteInsightHub@gmail.com. ***Teacher-created lessons and activities on creating & analyzing Histograms, Box Plots, & Dot Plots!
Subjects:
Grades:
7th - 12th, Higher Education, Adult Education, Staff
Types:
Showing 1-24 of 299 results


