TPT
Total:
$0.00

Categorical Data Display Pie Chart & Bar Chart: Worksheet, CW, HW CP & AP Stats

Rated 4 out of 5, based on 1 reviews
4.0 (1 rating)
;
Alca Math Help
26 Followers
Grade Levels
8th - 12th, Higher Education, Adult Education, Homeschool, Staff
Standards
Formats Included
  • PDF
Pages
6 pages
$2.50
$2.50
Share this resource
Report this resource to TPT
Alca Math Help
26 Followers

Description

If you are looking for an easy to follow for students. You are at the right place. This is a quick and easy to follow activity sheet that brings across the concept clear and precise. Teachers in my department love this activity sheet.  This is useful of CP Probability and Statistics, AP Statistics and Algebra 1 statistics unit.

Categorical data and Display Variables Objectives

At the end of the lesson students should be able to:

1. Correctly define categorical and quantitative data with examples

2. Label and classify variables as categorical and quantitative

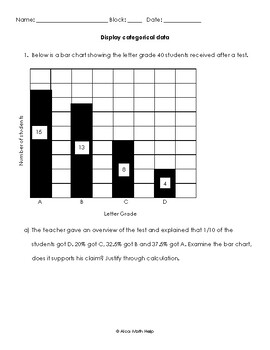
3. Display categorical on pie chart and bar chart

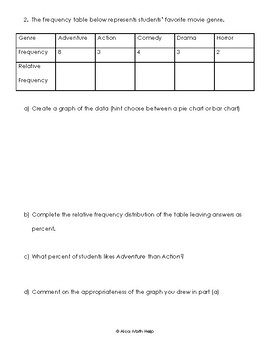
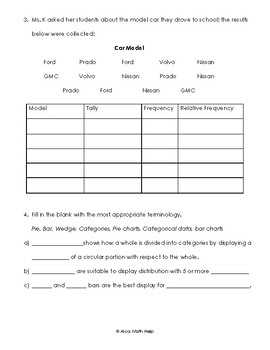
4. Create one way tables using frequency counts and percent

5. Interpret one way and two way tables

6. Differentiate between bar and pie chart based on display and properties

7. State sub categorical data based on main category given

Total Pages
6 pages
Answer Key
Included
Teaching Duration
45 minutes
Report this resource to TPT
Reported resources will be reviewed by our team. Report this resource to let us know if this resource violates TPT’s content guidelines.

Standards

to see state-specific standards (only available in the US).
Understand that patterns of association can also be seen in bivariate categorical data by displaying frequencies and relative frequencies in a two-way table. Construct and interpret a two-way table summarizing data on two categorical variables collected from the same subjects. Use relative frequencies calculated for rows or columns to describe possible association between the two variables. For example, collect data from students in your class on whether or not they have a curfew on school nights and whether or not they have assigned chores at home. Is there evidence that those who have a curfew also tend to have chores?
Understand that rewriting an expression in different forms in a problem context can shed light on the problem and how the quantities in it are related. For example, 𝘢 + 0.05𝘢 = 1.05𝘢 means that “increase by 5%” is the same as “multiply by 1.05.”

Reviews

Questions & Answers

26 Followers