107 results
9th grade statistics independent work packets
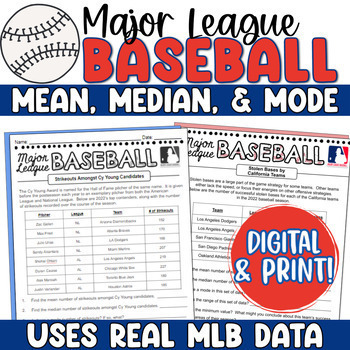
Baseball Math Mean, Median, Mode - MLB Baseball Measures of Central Tendency
This real-world baseball math statistics project asks students to determine mean, median, mode, and range for a variety of actual statistics from the 2023 Major League Baseball season. Perfect to excite any sports enthusiasts! It includes both a traditional print option and a digital version, made for Google for any 1:1 classrooms!Each slide within the activity is dedicated to a different statistic (for example, strikeouts amongst Cy Young candidates, or homeruns amongst MVP candidates). Stud
Subjects:
Grades:
6th - 9th
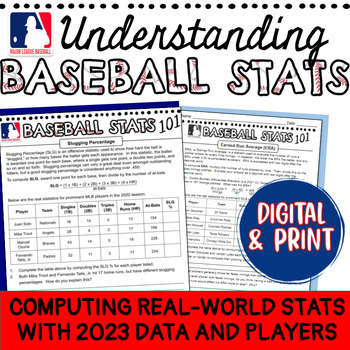
Understanding Baseball Stats MLB Math Sports Statistics Activity Digital & Print
This math baseball statistics activity is perfect for engaging your sports enthusiasts! It includes a Google Slides activity in which students explore and compute different baseball statistics using real numbers from the 2023 season, as well as the traditional print version. Students will enjoy seeing players they know and the real-life stats, and the higher order thinking questions will have them making connections in no time!This activity is great for enrichment, during baseball season, or fo
Subjects:
Grades:
7th - 10th
Types:
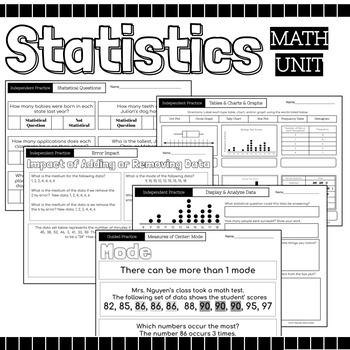
Statistics Math Packet {Data, Charts, Graphs, Mean, Median, Mode, Range, Spread}
52 Page Statics Unit Includes: Guided Instruction & Independent Practice Pages Usage Suggestions and IdeasThis resource can be utilized in numerous ways, here are some ideas:use for guided practiceassign as partner workassign as independent practicecan be used for morning workuse for reteaching in small group settinguse as review prior to assessmentuse as review in continuing to strengthen skillassign for homeworkuse as independent work during math centersTopicsRecognize Statistical Question
Subjects:
Grades:
4th - 12th
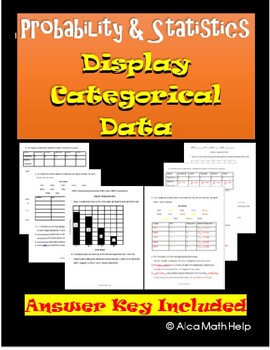
Categorical Data Display Pie Chart & Bar Chart: Worksheet, CW, HW CP & AP Stats
If you are looking for an easy to follow for students. You are at the right place. This is a quick and easy to follow activity sheet that brings across the concept clear and precise. Teachers in my department love this activity sheet. This is useful of CP Probability and Statistics, AP Statistics and Algebra 1 statistics unit. Categorical data and Display Variables ObjectivesAt the end of the lesson students should be able to:1. Correctly define categorical and quantitative data with examples2.
Subjects:
Grades:
8th - 12th, Higher Education, Adult Education, Staff
AP Statistics - 147 Google Form Companions for ALL AP Daily Videos
Do you require your students to watch the awesome AP Daily videos that College Board provides? Me too! But I needed a way to ensure the students were actually watching this resource and taking away all the valuable information they contain. These Google Forms allowed me to confirm that students were making the most of the AP Daily videos.This download contains 147 google forms. Each form is a companion to the 147 AP daily videos located in the AP Statistics course for all units from 1-9.
Subjects:
Grades:
9th - 12th
CCSS:
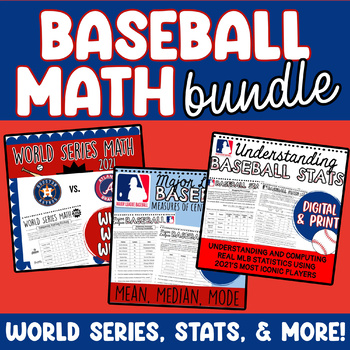
Baseball Math Activities Bundle for Real-World Statistics and World Series
This baseball math bundle includes three real world baseball stats products that are perfect for engaging your sports lovers! Students compute baseball stats, compare world series teams, and explore measures of central tendency using real-world stats!In World Series Math, students must determine which team is more likely to win comparing their players and statistics from the past season. Understanding Baseball Stats explains to students the meaning of common baseball statistics and how to comp
Subjects:
Grades:
6th - 9th
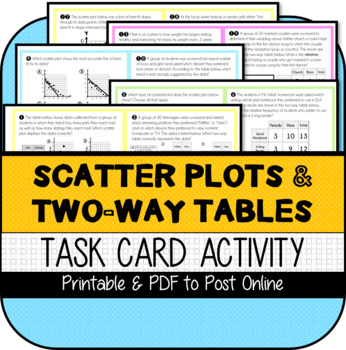
Scatter Plots & Two-Way Tables TASK CARDS
This resource was developed to meet the requirements of the 8th Grade Statistics & Probability Standards below:CCSS.MATH.CONTENT.8.SP.A.1 Construct and interpret scatter plots for bivariate measurement data to investigate patterns of association between two quantities. Describe patterns such as clustering, outliers, positive or negative association, linear association, and nonlinear association.CCSS.MATH.CONTENT.8.SP.A.2 Know that straight lines are widely used to model relationships between
Subjects:
Grades:
7th - 9th
Also included in: Scatter Plots & Two-Way Tables UNIT BUNDLE
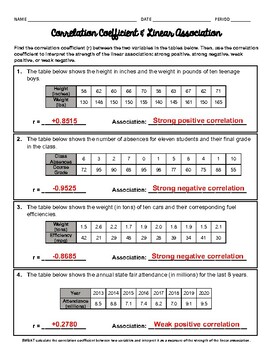
Correlation Coefficient and Linear Association Worksheet
8 question worksheet on using technology to find the correlation coefficient, and use it to determine the strength of a linear association (strong positive, strong negative, weak positive, or weak negative). #1 - 8 given a table in context of real-world problems, use technology to find the correlation coefficient (r) between the two variables. Then use r to determine the strength of the linear association. Answer key included.VISIT US AT WWW.ALMIGHTYALGEBRA.COM FOR MORE RESOURCES AND BUNDLED DIS
Subjects:
Grades:
8th - 12th
CCSS:
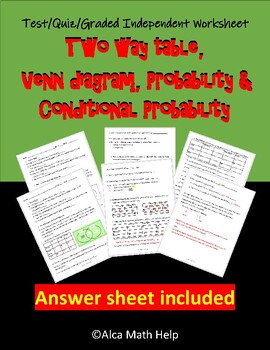
Unit Test/Quiz/Packet- Two-way table, Venn diagram, Conditional Probability
If you are looking for an easy to follow for students. You are at the right place. This is a quick and easy to follow activity sheet that brings across the concept clearly and precisely. Teachers in my department love this activity sheet. This is useful for CP Probability and Statistics, AP Statistics and Algebra 1 statistics unit.5W’s and How of statisticsAt the end of the lesson students should be able to:1. Recall the history of statistics2. Define the 5W’s and How of statistics with example
Subjects:
Grades:
9th - 12th, Higher Education, Adult Education, Staff
CCSS:
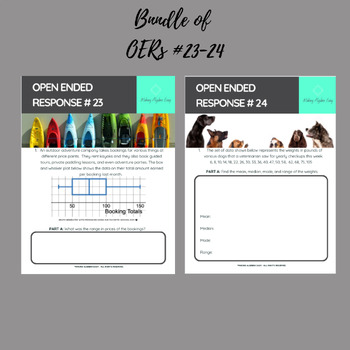
Algebra 1 Keystone Prep: OERs 23-24 Bundle on Data Analysis
This includes OERs #23 & 24. Each include open-ended questions that require students to show and explain their reasoning and to apply the concepts of data analysis involving a box and whisker plot and mean, median, mode, and range. These are appropriate for an Algebra 1 unit on Data Analysis. They are aligned the the Pennsylvania Keystone Exam but are also appropriate for other states for teachers who would like students to apply and explain.
Subjects:
Grades:
8th - 9th
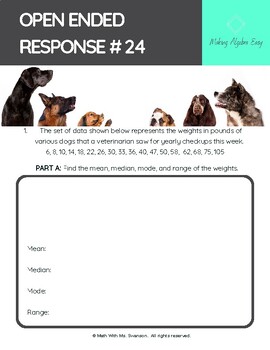
Algebra 1 Keystone Prep - OER 24 on Mean, Median, Mode, and Range
This is an open-ended response style question with multiple parts. This is appropriate for Algebra 1. Students need to first find the mean, median, mode, and range of a data set. They they need to interpret what will happen with the addition of a new data point.Pages 1 & 2 are the student version of the question with a pretty layout.Pages 3 & 4 are the teacher version / detailed annotated answer key.I used the open-ended questions in my Pennsylvania Algebra 1 classroom weekly in order t
Subjects:
Grades:
8th - 9th
Also included in: Algebra 1 Keystone Prep: OERs 23-24 Bundle on Data Analysis
Data and Statistics Review: Measures of Center, Dot and Box Plots, and More
This Data and Statistics Review Packet is perfect for Statistics students or anyone doing SAT Math prep. Included Types of Data Representations:Distance vs. time graphBar graphDouble bar graphLine graphBoxplotScatterplot with and without a best fit lineDot plotThis is the figure and graph analysis chapter from my book "Overcoming Digital SAT Math" by Sophia Garcia. It contains 45 mostly SAT-style math questions. Bundle and save by getting my entire Digital SAT Math Workbook or just get my SAT ma
Subjects:
Grades:
9th - 12th
Also included in: SAT Math Prep Workbook for Digital SAT
Probability & Statistics- Two-Way Table Worksheet, Homework, Quiz, AP Review
If you are looking for an easy to follow for students. You are at the right place. This is a quick and easy to follow activity sheet that brings across the concept clearly and precisely. Teachers in my department love this activity sheet and the students enjoy it. This is useful for CP Probability and Statistics, AP Statistics and Algebra 1 Statistics unitAt the end of the lesson students should be able to:1. Define two-way tables with its properties.2. Create two- way tables using frequency co
Subjects:
Grades:
9th - 12th, Higher Education, Adult Education, Staff
CCSS:
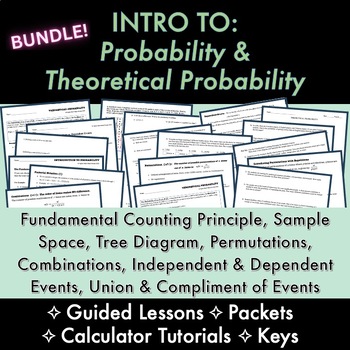
BUNDLE: Intro to Probability & Theoretical Probability LESSONS, PACKETS, KEYS
➤ LESSON 1: Intro to probability full 2 to 3-day GUIDED-NOTES lesson packet, 40 total exercises (can be used as classwork and/or homework), notes and step-by-step answer keys. What is the Fundamental Counting Principle? Definition and connection to Sample Space and Tree Diagrams. What is permutation vs. combination, and when do we use them? Students learn what a factorial is through flawless connections to fundamental counting principle and permutations, and how to simplify factorials without us
Subjects:
Grades:
9th - 12th
CCSS:
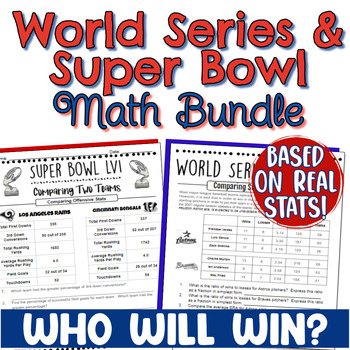
World Series & Super Bowl Math Bundle - Real World Sports Math
Looking for a way to engage your sports lovers in your middle or high school math class? This World Series and Super Bowl Math activity is based on real-world data and statistics, and asks students to determine who will win based on the actual teams.The bundle includes two resources: one for Super Bowl and one for World Series. Each resource is updated yearly to reflect the two teams playing in this year's series or game. The students are asked to make a prediction of the winner after analyzi
Subjects:
Grades:
6th - 9th
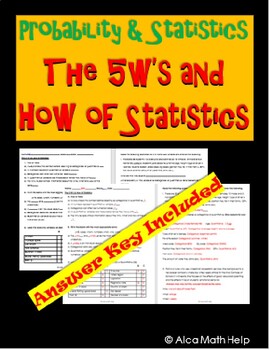
The 5W's & How of Statistics Worksheet, CP Stats, AP Stats, HW, Back-to-School
If you are looking for an easy to follow for students. You are at the right place. This is a quick and easy to follow activity sheet that brings across the concept clearly and precisely. Teachers in my department love this activity sheet. This is useful for CP Probability and Statistics, AP Statistics and Algebra 1 statistics unit.5W’s and How ObjectivesAt the end of the lesson students should be able to:1. Recall the history of statistics2. Define the 5W’s and How of statistics with examples3.
Subjects:
Grades:
8th - 12th, Higher Education, Adult Education, Staff
CCSS:
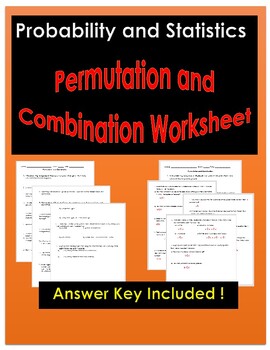
Permutation and Combination Worksheet/Activity/Packet | Alca Math Help
If you are looking for an easy to follow for students. You are at the right place. This is a quick and easy to follow activity sheet that brings across the concept clearly and precisely. Teachers in my department love this activity sheet. This is useful for CP Probability and Statistics, AP Statistics and Algebra 1 statistics unit.Objectives1. Recognize the difference between permutation and combination.2. Use the fundamental counting principle: or/and.3. Correctly use both formula either by ha
Subjects:
Grades:
9th - 12th, Higher Education, Adult Education, Staff
CCSS:
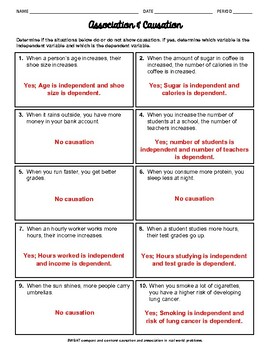
Association or Causation Worksheet
20 question worksheet on association and causation in real-world problems. #1 - 20 Given verbal descriptions (of 2 variables) determine if they show causation. If they do, tell which variable is the independent variable, and which is the dependent variable. Answer key included.VISIT US AT WWW.ALMIGHTYALGEBRA.COM FOR MORE RESOURCES AND BUNDLED DISCOUNTS!!
Subjects:
Grades:
7th - 12th
CCSS:
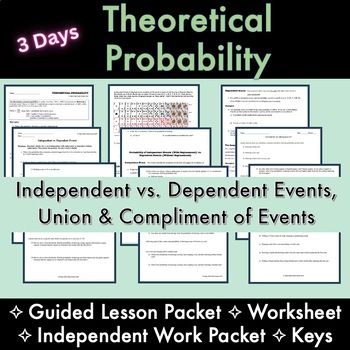
Theoretical Probability: Independent and Dependent Events LESSON, PACKET, KEYS
Theoretical Probabilities - Probability of an Event P(E), Independent vs. Dependent Events formulas, difference between a probability With vs. Without Replacement, formulas of probability for the Union and Complement of an event. Finding theoretical probabilities using tree diagrams, sample space, and fundamental counting principle to help. Examples include topics of dice, coins, marbles, deck of cards, and much more!----------------------------------Also included in my BUNDLES: ✫ Intro to Proba
Subjects:
Grades:
9th - 12th
CCSS:
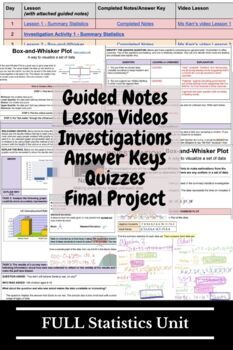
Statistical Analysis UNIT
This 6 lesson unit was designed for a distance learning or hybrid model classroom. There 4 video lessons on finding summary statistics, box-and-whisker plots, normal distributions, and using technology. There are also included investigation activities for students with clear and concise directions so they can go investigate further applications and properties of the mathematics presented in the lessons. The last 2 lessons focus on applications of misleading statistics and possible bias in sampli
Subjects:
Grades:
9th - 12th
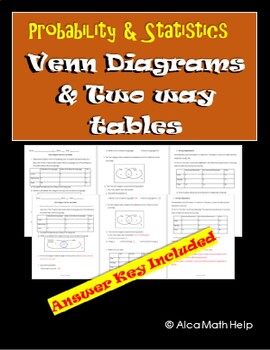
Venn Diagrams and Two-way table Worksheet CP Probs, Homework
If you are looking for an easy to follow for students. You are at the right place. This is a quick and easy to follow activity sheet that brings across the concept clearly and precisely. Teachers in my department love this activity sheet. This is useful for CP Probability and Statistics, AP Statistics and Algebra 1 statistics unit-Venn diagram ObjectivesAt the end of the lesson students should be able to:1. Identify a Venn diagram and its properties2. Shade specific regions of the Venn diagram(
Subjects:
Grades:
8th - 12th, Higher Education, Adult Education, Staff
CCSS:
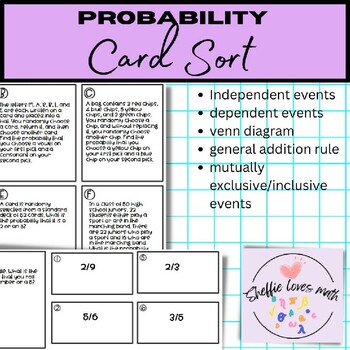
Probability CARD SORT Independent Dependent Mutually Exclusive General Addition
Probability Card Sort- Independent, dependent, venn diagrams, general addition rule, mutually exclusive vs inclusive events- Florida standards are included for your documentation. Answers with work as well. My kids loved it :) Great for Algebra, Algebra 2 and Statistics students.
Subjects:
Grades:
9th - 12th
CCSS:

Using Desmos to find statistics, make graphs, and linear regression - self guide
This is a digital resource that guides students through finding statistics (mean, median), making graphs (histograms, dotplots, boxplots, and scatterplots) and writing the equation of the line of best fit using Desmos.
Subjects:
Grades:
8th - 9th
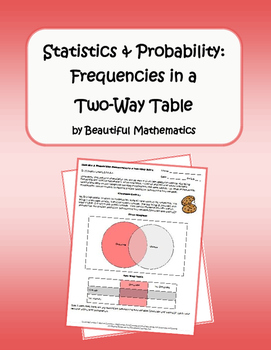
Statistics & Probability: Frequencies in a Two-Way Table
Students will understand that patterns of association can also be seen in categorical data by displaying frequencies and relative frequencies in a two-way table. Construct and interpret a two-way table summarizing data on two categorical variables collected from the same subjects. Use relative frequencies calculated for rows or columns to describe possible association between the two variables.Visit my Beautiful Mathematics Store for more engaging math lessons.Provide feedback and get TPT credit
Subjects:
Grades:
7th - 9th
Showing 1-24 of 107 results


