Comparison Box and Whisker Plots Worksheet, Quiz, Test for Stats & AP Stats
- PDF
Description
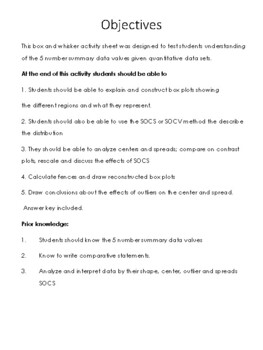
This box and whisker activity sheet was designed to test students understanding of the 5 number summary data values given quantitative data sets. Perfect for students in grade 10-12 doing statistics and you want to give them a challenge and should be manageable for students doing AP STATS
At the end of this activity students should be able to
1. Students should be able to explain and construct box plots showing
the different regions and what they represent.
2. Students should also be able to use the SOCS or SOCV method the describe the distribution
3. They should be able to analyze centers and spreads; compare on contrast plots, rescale and discuss the effects of SOCS
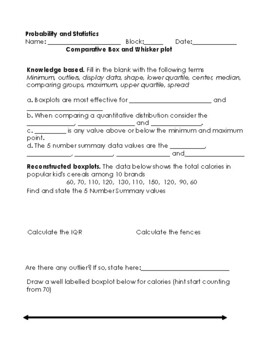
4. Calculate fences and draw reconstructed box plots
5. Draw conclusions about the effects of outliers on the center and spread.
Answer key included.
Prior knowledge:
1.Students should know the 5 number summary data values
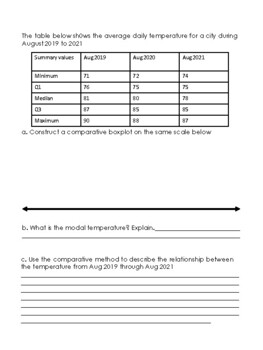
2.Know to write comparative statements.
3.Analyze and interpret data by their shape, center, outlier and spreads SOCS


